James Stanley of DailyFX.com explains different ways short-term price action can be used to identify support and resistance areas for stop loss and target placement when trading currency pairs.
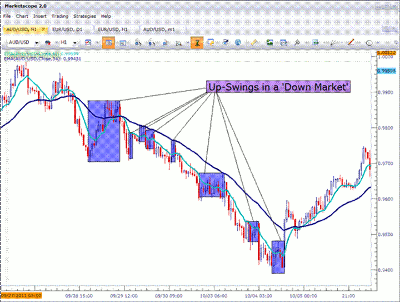
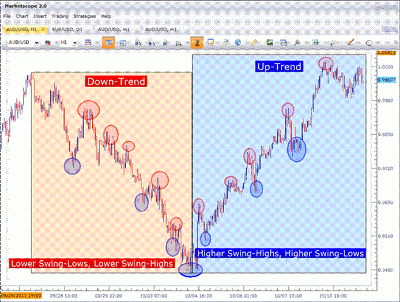
Any chartist that has spent considerable time analyzing candlesticks would agree that market movements rarely take place in a linear fashion. Downtrends are often accented with upswings, as the chart below points out:
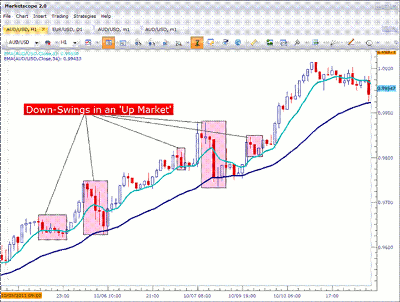
The exact opposite can be said for uptrends, which are often accentuated with downswings.
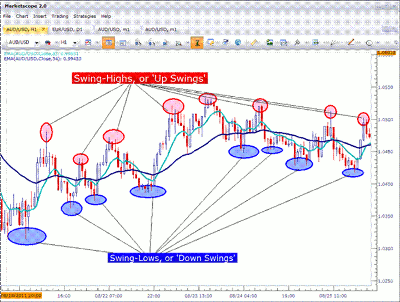
And of course, if we have a range, we can notice both upswings and downswings.
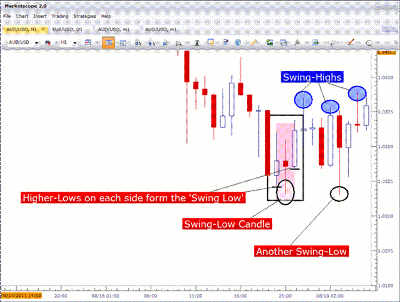
Swing lows, or downswings, can be classified as a low point of price that is accompanied by a higher-low value in price on each side of the candle.
|pagebreak|The multiple swings exhibited by price behavior throughout the day can be used for a multitude of functions. For instance, for traders wishing to grade trend, they can often do so by observing higher highs and higher lows, or lower lows and lower highs.
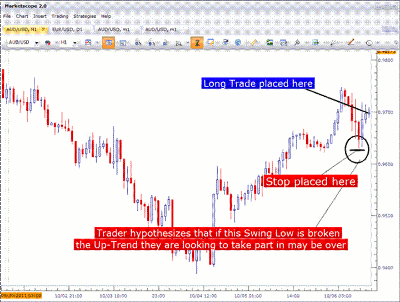
Taken a step further, traders wishing to manage risk can potentially look to these swings for stop placement. For example, in the chart below, the trader looking to take on a long position can adopt the stance that if price breaks this swing low, then we no longer want to be in the trade because the trend may no longer be to the upside.
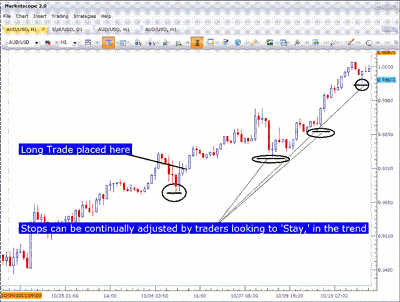
And of course, once a trader is in a position, this same mindset can be used in position management. The chart below illustrates:
We’ve covered three of the more popular mechanisms of swings in the market, but we are just scratching the surface. There are numerous additional mannerisms in which these swings can be used by the price action trader, more of which I will cover in tomorrow’s article.
By James Stanley of DailyFX.com

