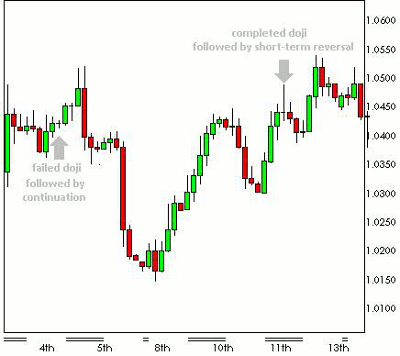
The first lesson in this multi-part series covers the doji, a neutral indicator that can be useful in either confirming or negating important price action on candle charts.
The following article will use doji for the purpose of providing specific and detailed examples; however, the same concepts apply to other candlestick reversal formations like tweezers, shooting stars, and hammers, for example. These basic formations are rather helpful ways of confirming other market reversal indicators such as the geometric, Fibonacci-based patterns we primarily use to identify technical trading opportunities at FX360.
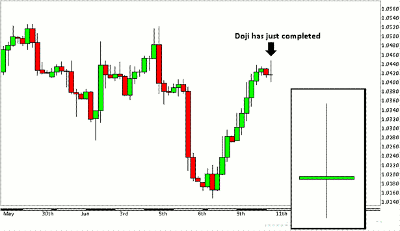
Doji are neutral indicators that simply represent a “tie” in the never-ending battle between buyers (bulls) and sellers (bears). They form when the open and close of a candlestick are equal or very close to equal and are considered a neutral formation suggesting indecision between buyers and sellers. The bullish or bearish bias depends on the previous price swing, or trend.
The length of the upper and lower shadows (wicks and tails) may vary, giving the appearance of a plus sign, cross, or inverted cross. Completed doji may help to either confirm, or negate, a potential significant high or low, especially when found at support or resistance, after a long trend or wide-ranging candlestick.
Although they may be helpful in identifying/confirming that a trend reversal may be underway on their own, doji are not much help in making sound, high-probability trading decisions (as is the case with any single indicator). This is mainly due to the fact that even if a doji does signal the beginning of a reversal, it will not give any indication as to how far the reversal may go, or how long it may last.
NEXT: Using Doji to Confirm or Negate Action on the Charts
|pagebreak|High-probability trades are identified through a convergence of trading signals that help not only identify, but confirm, both entries and exits based on two key components: (1) Trend (2) Support and resistance. Without having identified those two components in advance, placing a trade based on any solo indicator is nothing more than a coin toss in terms of probabilities.
When used in conjunction with other forms of analysis, however, doji can be helpful in either confirming or negating significant high/lows, which in turn can help a trader determine whether a trend is likely to reverse, or perhaps continue.
In other words, a single doji is a just a small piece of the puzzle in helping a trader determine a higher-probability point at which to enter or exit a position.
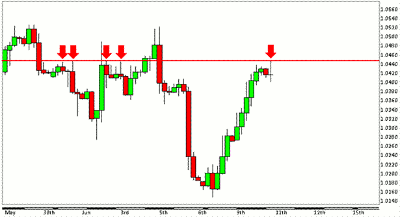
Let’s take a look at how doji can be used with other basic technical indicators to make a high-probability trading decision. The first things we want to determine are support levels, resistance levels, and trend. The idea is to sell near resistance, and buy near support. Trend helps tell a trader which direction to enter, and which to exit.
The most basic way to determine support and resistance is based off previously established highs and lows.
Read Part 2 here.
By Roger A. Stojsic of GFTForex.com


