Oscillators like the slow stochastic can be used to "x-ray" the markets and either confirm price action or uncover hidden weakness, allowing traders to stay on the proper side of the dominant trend.
During every Online Trading Academy class, instructors will emphasize repeatedly the importance of buying in clear demand zones and selling in supply zones, being aware of the bigger-picture trend. One of the most common complaints we instructors hear is, "I'm not sure which supply zone to sell in or which demand zone to buy in. There are so many of them!" While this can be true, one of the odds enhancers we can use is an oscillator of the price action.
One way to look at oscillators (this week I'll examine slow stochastics) is to imagine that they are showing the strength of the internals of the move. While at my last dentist visit, my mind wandered into the trading arena as I waited to get my teeth cleaned. Always trying to apply "regular world" experiences to the world of trading, I asked the dentist why he takes x-rays of people's teeth.
The answer was, of course, very obvious: "We can't always tell what's going on inside the tooth just by looking at the outside." "So essentially, you're checking the internal health of my teeth, which may not match what looks to be healthy on the outside?" I asked. "Precisely." This immediately made me think of indicators and oscillators when used in trading.
My preferred way of using the slow stochastics is to hunt for the divergences in price and the oscillator, specifically in comparing the highs versus highs and lows versus lows. If the price action is showing new highs while the oscillator is showing equal or lower highs, we define that as a bearish divergence and expect a possible turn to the downside. If the price action is showing lower lows while the oscillator is showing equal or higher lows, that is a bullish divergence where we may expect a turn to the upside.
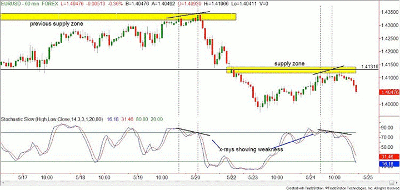
In the above EUR/USD chart, you can plainly see several supply zones that were hit as the pair rallied into the 1.4131 zone. While a few of the levels slowed down our currency pair, the stochastics (internal strength) didn't give us an obvious divergence until that 1.4131 level.
Using the technique mentioned previously, as price was rallying to higher highs, the slow stochastic was showing lower highs. If you used this simple divergence, it would have kept you from trying to "pick the tops" as the pair was still showing strength.
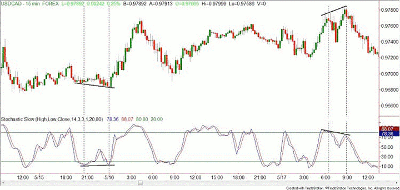
The following is a chart of the USD/CAD showing an example of both a bullish and bearish divergence on a 15-minute chart. There are a couple more in there; can you see them?
So what should be the entire strategy if you choose to add an oscillator into your trading plan? First, define your clear supply and demand zones and determine the dominant trend for the time frame you are trading. Wait for the price action to enter the zone in the direction you want to trade and pull the trigger when you get the divergence you want. While there isn't an obvious divergence at every turning point in the market, waiting for the clear indications will help you be more selective in your trades and avoid picking tops and bottoms.
You can learn about trading in the most unlikely places...even the dentist's office!
By Rick Wright, instructor, Online Trading Academy


