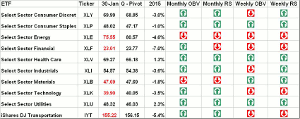
Five of the monitored funds closed below or at their quarterly pivots last week as selling picked up going into the close, so MoneyShow’s Tom Aspray examines the technical studies to determine where three ETFs will go in the coming weeks.
Stocks finished the week on a sour note as the selling picked up going into the close. Typically, such a weak close would precipitate a wave of heavier selling once the futures opened Sunday night. So far, that has not occurred as the S&P futures are up in early trading and the EuroZone markets are mixed in early trading.
For the month, the Spyder Trust (SPY) was down 2.96%, the SPDR Dow Industrials dropped 3.53% and the PowerShares QQQ Trust (QQQ) was down 2.08%. The small-caps did a bit worse as the iShares Russell 2000 (IWM) was down 3.28%.
Last week’s action caused further deterioration in the weekly technical studies and I wondered Friday whether the strength of a few key tech stocks like Apple, Inc. (AAPL) or in the energy stocks can help the market from falling further.
Some of the more targeted sector funds did even worse as the Sector Select SPDR Financial (XLF) was down 7.0%. The XLF had closed below its quarterly pivot on Friday, January 16, warning of a trend change. On the table, you will note that the down arrows indicate that the monthly/weekly OBV and RS analysis are all negative.
The new sector performance table shows that five of the monitored funds closed below or at their quarterly pivots. Of course, the Sector Select SPDR Energy (XLE) has been below its quarterly pivot since it closed at $92.51 on September 12. It has since lost 18.3%.
With last week’s close at or below the quarterly pivots, it is important to closely examine the intermediate-term technical studies to determine where these three ETFs will go in the coming weeks.
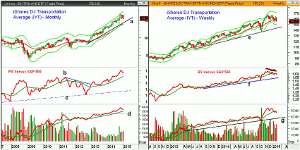
Chart Analysis: The transportation stocks have been one the strongest sectors in the bull market, so the close in the iShares DJ Transportation Average (IYT) below its quarterly pivot warrants close scrutiny.
- IYT was down 5.4% in January as the December low was slightly violated.
- The monthly uptrend is at $144.08 with the monthly starc- band now at $138.76.
- In October, IYT dropped to a low of $137.05.
- The monthly relative performance did make a new high in November but has now turned lower.
- The downtrend in the monthly RS, line b, was overcome in January 2013 as IYT gained over 41% that year.
- The monthly OBV moved above its WMA in late 2012 and is still clearly positive.
- There is monthly resistance now at $165.17-$166.17 area.
The weekly chart of iShares DJ Transportation Average (IYT) shows that the starc+ band was tested for three weeks at the end of November. IYT is down 7.3% from the all time high at $167.54.
- The weekly close was just below the 20-week EMA at $157.22.
- There is next weekly support at $154.04.
- The weekly starc- band is at $148.39 with February’s projected monthly support at $147.01.
- The quarterly pivot support is at $144.76 with the long-term support, line e, at $144.
- The weekly RS line did confirm the new price highs in November but has been declining every since.
- The RS line is still well above its long-term uptrend, line f.
- The weekly on-balance volume (OBV) dropped back below its WMA last week.
- The important weekly OBV support, line g, is well below current levels.
- The monthly pivot is at $158.14 with the declining 20-day EMA at $159.40.
- For February, the monthly projected pivot resistance is at $162.25.
Next: Two More Key Sector ETFs to Watch
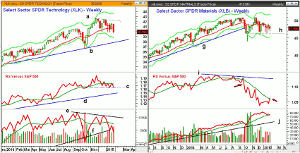
|pagebreak|Even the powerful rally in Apple, Inc., which is a 17.7% holding in the Sector Select SPDR Technology (XLK), could not keep it from closing below its quarterly pivot on Friday.
- The weekly chart shows a series of slightly lower lows over the past seven weeks.
- The monthly projected pivot support is at $38.37 with the starc- band at $38.47.
- The weekly support that connects the 2014 lows is at $37.77.
- The weekly RS line is now testing the October lows, line c, as it reversed back below its WMA last week.
- The intermediate-term uptrend in the RS, line e, is still significantly lower.
- The weekly OBV formed a negative divergence at the November highs, line e.
- The longer-term uptrend, line f, was broken last week.
- It was also violated at the October lows.
- The monthly RS and OBV analysis are both positive.
- The declining 20-day EMA is at $40.72 with the doji high from January 26 at $41.64.
The Sector Select SPDR Materials (XLB) closed right on its quarterly pivot at $41.69, though it traded as high as $48.26 on Friday.
- The long tails on the weekly candles over the past fifteen weeks indicate support at $46.26.
- The December low was $45.88 with the monthly projected pivot support at $45.
- The weekly starc- band is at $44.71 with the October low at $43.81.
- The uptrend that goes back to 2013, line g, was broken in early October.
- The weekly relative performance formed lower highs, line i, as XLB was moving higher.
- It completed its top formation in October as it dropped sharply.
- The RS line has improved over the past few weeks and is now back above its WMA.
- The weekly OBV closed the week just barely above its WMA so the close this week will be important.
- The 20-day EMA is at $48.04 with the last swing high at $49.09.
What it Means: The positive monthly technical outlook for the iShares DJ Transportation Average (IYT) suggests that the current correction will be a buying opportunity. I would look for support in the $148-$150 area to hold.
The longer-term outlook for the Sector Select SPDR Technology (XLK) also suggests a further decline will also be a buying opportunity. The next good support is in the $38.50 area.
The Sector Select SPDR Materials (XLB) needs to be watched closely this week as the daily studies are mixed at this time.
How to Profit: No new recommendation.


