The financial sector has been under pressure since the last day of 2014 and the regional bank stocks have been hit the hardest, so MoneyShow's Tom Aspray examines the charts to determine if this trend will continue.
Even the strong results from two tech giants could not prop up stocks Wednesday as in the afternoon traders ignored the latest FOMC announcement and instead focused on the further plunge in crude oil prices.
The selling really picked up in the last hour and the market internals were very negative as the ARMS Index closed at 3.61. This is the most oversold reading of the year as it hit 3.42 in December and February. Such high readings are often associated with panic lows.
Many are expecting that energy company earning's will drop 20-25% from the previous year, and on Wednesday, oil supplies reached a 30 year high. Volume in the crude oil futures did increase Wednesday, and while the market is clearly oversold, there are no signs yet of a bottom.
The financial sector has been under pressure since the last day of 2014 when the Sector Select Financials (XLF) triggered a daily low close doji sell signal. Over the past month, the XLF is down 5.08%. The regional banking stocks have been hit even harder as the SPDR S&P Regional Banking ETF (KRE) has lost 9.81%.
A look at the monthly and weekly analysis of this financial industry group can help you decide whether this trend will continue as many of the regional banks have yet to release their earnings.
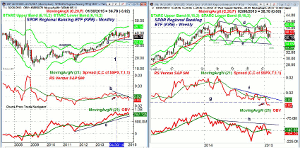
Chart Analysis: The SPDR S&P Regional Banking ETF (KRE) looks ready to have its lowest monthly close since October 2013. KRE has 84 holdings with the top ten making up just 15% of the portfolio. It has a current yield of 1.84% and an expense ratio of 0.35%.
- The 20-month EMA is now at $36.33 with the monthly starc- band at $32.55.
- The major support from 2010-2012 is in the $29 area.
- The monthly relative performance violated its uptrend and WMA in April 2014, line 1.
- The RS (line b) has formed lower highs, while prices have moved sideways.
- The monthly OBV is now testing its WMA and has stronger support at line c.
- There is monthly resistance now at $41.43.
The weekly chart of SPDR S&P Regional Banking ETF (KRE) shows what appeared to be an upside breakout in November 2014 as resistance at line d, was overcome. A close look at the technical studies would have caused you to question the breakout.
- KRE is now trying to hold the three week lows at $36.35.
- There is weekly chart support, line e, and the starc- band at $34.26.
- For February, the monthly projected pivot support is at $33.35.
- The weekly relative performance formed lower highs, line f, as KRE broke out in November.
- The RS line violated long-term support in early January as it is leading prices lower.
- As KRE was rallying last November, the volume was weak as the OBV just rebounded back to resistance at line h.
- The OBV has been below its WMA for the past few weeks.
- The declining 20-day EMA is now at $38.53.
Next: Two More Financials to Watch
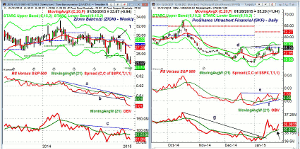
|pagebreak|Zions Bancorporation (ZION) is a $4.8 billion company that provides banking and other services in the Western US. It reported a profit on Monday versus a loss a year ago. It missed slightly on both earnings and revenues.
- The stock stabilized initially on the report but then turned lower.
- ZION is down 3.7% for the week and is down 16.7% over the past month.
- ZION closed below its quarterly pivot on November 28 (point 1) signaling a change in trend.
- Prices are now not far above the starc- band at $23.10.
- The quarterly projected pivot support is at $22.90.
- The relative performance has been in a solid downtrend for most of 2014, lines a and b.
- The RS line broke further support, line b, at the start of the year.
- The OBV rebounded above its WMA at the end of the year, but stayed below resistance, which was a sign of weakness.
- The monthly OBV and RS analysis have been below their WMAs since April 2014.
The ProShares Ultrashort Financials (SKF) is an inverse ETF that corresponds to twice the daily performance of the Dow Jones US Financial Index. It has an expense ratio of 0.95%.
- It has gained 11.7% in the past month and is somewhat thin with an average volume of 42K.
- The daily chart shows Wednesday's 3.6% gain as it closed just below the quarterly pivot at $55.44.
- A strong move above resistance at $56.60 would project a move to the $62-$63 area.
- The quarterly projected pivot resistance is at $62.25.
- The daily relative performance shows a potential bottom formation, lines e and f.
- A move above line e, will signal it is outperforming the S&P 500.
- The daily on-balance volume (OBV) broke its long-term downtrend, line g, in early January.
- It has turned up after testing its WMA (see arrow).
- The weekly OBV and RS lines are both above their WMAs.
- There is minor support at $53.70-$54 with stronger at $52.
What it Means: I discussed the negative technical outlook for the big banks in Big Banks: Are the Charts Really That Bad? Though the market and financial sector are oversold, a bounce in the financials is likely to be a selling opportunity.
For aggressive traders, the ProShares Ultrashort Financials (SKF) looks like a good trade as the sector is likely to stay weaker than the overall market. The entry in SKF would best be based on intraday charts where the risk can be better controlled. I would recommend taking a quick profit if you get it.
How to Profit: No new recommendation.
Here are some of Tom's recent articles you might enjoy:
Are the Homebuilders Still in a Bear Market?
The Week Ahead: Barron's Roundtable-Too Cautious Like 2013?
Three Market Leading Healthcare Picks
Get an Edge from Yearly Charts


