There has been some positive volume action in the technology sector, so MoneyShow’s Tom Aspray takes to the charts to see if one semiconductor ETF and two individual stocks could lead the sector higher.
The stock market continued to edge higher Wednesday ahead of the widely anticipated ECB meeting today. The market internals at 2-1 positive were stronger than prices. Still, the major averages are locked in their trading ranges. The energy stocks led the market higher as the Sector Select Energy (XLE) was up over 2%.
The Sector Select Utilities (XLU) made another new all time high while the Sector Select Industrials (XLI) gained 0.82%. The transportation stocks are part of the industrial sector and the technical action in the iShares Dow Transportations (IYT) suggest that its correction may be over.
The S&P futures need a close above 2062 to signal that the correction is over with $206.50 being the key level in the Spyder Trust (SPY). There has been some positive volume action in the technology sector and a close in the Sector Select Technology (XLK) above $41.62 would be positive.
There is one part of the technology sector where the positive volume and relative performance analysis suggests it could lead the sector higher.
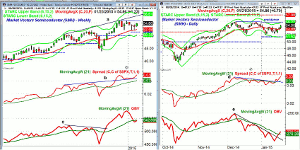
Chart Analysis: The Market Vectors Semiconductor (SMH) has total assets of $464 million, a yield of 1.32%, and an expense ratio of 0.35%. There are 25 stocks in the portfolio with Intel Corp. (19.8%) and Taiwan Semiconductor (15%) the two largest holdings.
- Over the past two weeks, SMH has dropped to test the 20-week EMA now at $52.46.
- The long tails on the candles indicate demand at these lower levels.
- As of Wednesday, SMH is trading above the prior two week highs at $54.47.
- The prior high was $55.92 with the weekly starc+ band at $58.61.
- The quarterly projected pivot resistance is at $63.58.
- The relative performance is breaking out to the upside, consistent with a market leader.
- The monthly RS analysis (not shown) is also making a new high and is well above its WMA.
- The weekly OBV is trying to turn up this week and would move back above its WMA with a strong close.
- The quarterly pivot is at $51.51 with the weekly starc- band at $50.35.
The daily chart of the Market Vectors Semiconductor (SMH) has closed higher for the past three days, closing back above the 20-day EMA at $53.89.
- It is still below the key daily chart resistance at $55.92.
- There is monthly projected pivot resistance at $57.98.
- A completion of the trading range has upside targets in the $59-$61 area.
- The daily RS line moved through its downtrend last week signaling it was a market leader.
- The daily OBV has broken its downtrend and moved back above its WMA.
- It has not yet confirmed a completed bottom formation so a pullback is possible before the bottom is complete.
- There is short-term support now at $53.50-$56 with stronger at $52.50.
Next: Two More Tech Stocks to Watch
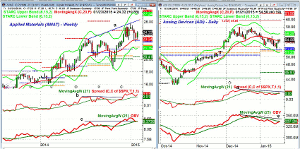
|pagebreak|Applied Materials (AMAT) is a $29.67 billion provider of semiconductor equipment and services. It has a yield of 1.7% and was up 43.2% in 2014.
- AMAT peaked at $25.71 in late 2014 and is now 5.41% below its high.
- The quarterly pivot at $23.06 was violated last week as the low was $22.86.
- The 50% Fibonacci support is at $22.11 with the weekly starc- band at $21.76.
- The weekly RS line has turned up from its WMA and did make a new high last month.
- The weekly OBV is now testing its rising WMA.
- Both the monthly OBV and RS analysis are positive.
- There is next resistance at $24.60-$25 area with the monthly projected pivot resistance is at $27.17.
- The quarterly projected pivot resistance is at $30.22.
Analog Devices (ADI) is a $17.07 billion designer and manufacturer of integrated circuits. It peaked in December at $57.99 and is now down 5.88% from this high.
- The low last week of $52.21 was close to the quarterly pivot of $51.93.
- The weekly starc- band and the 50% support are in the $52.14 to $50.28 area.
- The daily relative performance has just moved barely above its WMA.
- There is key resistance at line d.
- The weekly and monthly RS analysis is positive as the weekly has just pulled back to support.
- The daily OBV has rallied back to its declining WMA with stronger resistance at line e.
- With a higher close this week, the OBV will turn up from its rising WMA.
- A weekly close above $55.52 would be positive.
- The 127.2% Fibonacci retracement resistance target is at $59.59.
- This is very close to the monthly projected pivot resistance at $59.94.
What it Means: The semiconductor sector is acting quite well and both of the stocks are holdings of the Market Vectors Semiconductor (SMH). AMAT makes up 4.55% while ADI is a 3.78% holding.
The best choice for most, therefore, is SMH, but if the analysis is correct you are likely to get a bigger return in the individual stocks. All three picks satisfy the 6 point checklist detailed in the recent trading lesson.
How to Profit: For Market Vectors Semiconductor (SMH) go 50% long at $54.36 and 50% at $53.22 with a stop at $51.21 (risk of approx. 4.8%).
For Applied Materials (AMAT) go 50% long at $24.06 and 50% at $23.48 with a stop at $22.59 (risk of approx. 5%).
For Analog Devices (ADI) go 50% long at $52.88 and 50% at $52.12 with a stop at $49.86 (risk of approx. 5%).


