In spite of the gains in the major averages, not all stocks are making new highs with the averages, so MoneyShow’s Tom Aspray uses technical analysis to see if three stocks underperforming the S&P 500 look vulnerable to a further decline.
More records for the market to start off the holiday shortened week as the market internals were positive in line with the market’s gains. The small-caps once again led the way as the S&P 600 and Russell 2000 were both up over 1%.
The Dow Utilities and the Philadelphia Oil Service Index led on the downside losing over 0.80% on the day. The market seemed to shrug off the disappointing economic data and the market gets a series of new economic reports before Thanksgiving.
Today we get the second reading on the 3rd quarter GDP, the S&P Case-Shiller Housing Price Index, and Consumer Confidence. On Wednesday, we get the University of Michigan's month end reading on Consumer Sentiment, Durable Goods, New Home Sales, and the Pending Home Sales Index.
In spite of the gains in the major averages, not all stocks are making new highs with the averages. Those stocks that are currently looking toppy and are underperforming the S&P 500 may bear the brunt of the selling if the market turns low. These three Dow stocks look especially vulnerable.
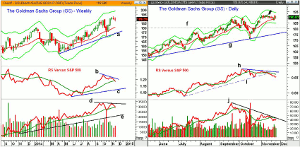
Chart Analysis: The Goldman Sachs Group (GS) has been trading in a narrow range for the past three weeks as dojis have formed.
- Last week’s low at $187.55 is the key level to watch on a weekly closing basis.
- If Friday’s close is below this level then a low close doji sell signal will be triggered.
- The rising 20-week EMA is at $181.73 with the quarterly pivot at $177.73.
- The weekly uptrend, line a, and the starc- band are at $174.50.
- The weekly relative performance peaked in early October and has been diverging from prices, line b.
- The decline in the RS line below its WMA is a sign of weakness.
- The weekly OBV peaked in early October and failed to make new highs in the past few weeks.
- This bearish divergence, line d, would be confirmed by a drop below the October lows.
- There is weekly resistance now in the $191.65-$192.68 area.
The daily chart of Goldman Sachs (GS) shows that it failed to make a new high last Friday as it failed well below the daily doji high that was formed on November 11.
- The flat 20-day EMA is at $188.67 with the daily swing low at $187.55.
- The daily starc- band is at $184.44 with further support in the $180 area, line f.
- The daily uptrend, line g, is in the $175 area.
- The daily relative performance has been diverging from prices since early October, line h.
- The RS line subsequently dropped below its uptrend, line i.
- The negative divergence in the OBV, line j, is even more pronounced as it peaked in September.
- The OBV is now below its flattening WMA.
NEXT PAGE: Two More Toppy-Looking Stocks to Watch
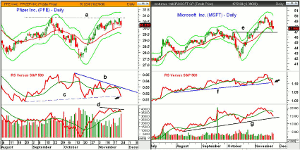
|pagebreak|Pfizer, Inc. (PFE) has made little upside in the past three weeks as it has stalled below the daily chart resistance at $30.78, line a. PFE has not yet closed below the weekly doji low of $29.76 from three weeks ago.
- The quarterly projected pivot resistance at $31.12 has also limited the upside.
- The quarterly pivot and daily starc- band are not far below current levels at $29.49.
- There is more important weekly support now in the $27.50 area.
- The daily relative performance has been diverging sharply since early October, line b.
- The RS line dropped below support, line c, on Monday.
- The weekly RS analysis (not shown) is also clearly in a downtrend.
- The daily on-balance volume (OBV) has also formed a negative divergence, line d, and volume increased Monday.
Microsoft, Inc. (MSFT) peaked on November 4 at $50.04, which was just below the October monthly projected pivot resistance at $50.90.
- It is already 4.9% below its high but is still up 30.2% YTD.
- The daily chart shows next support, line e, in the $47 area.
- The quarterly pivot support is still well below current levels at $44.91.
- The daily RS line dropped below its WMA two days after the high.
- The stronger RS support, line f, has now been broken.
- The daily OBV formed a minor negative divergence at the highs before dropping below its WMA.
- The OBV has more important support at line g.
- There is initial daily resistance now at $48.25-$49.
What it Means: The stock market remains resilient but—as I suggested in the Week Ahead column—those who have been long throughout the year should consider taking some profits on those stocks that have started to lag the market.
Light hedges would also not be a bad idea now since many who have been hedging all year have given up on this strategy.
These three Dow stocks are looking vulnerable to a further decline, though Microsoft, Inc. (MSFT), which is already well below its highs, may see a bounce from slightly lower levels.
How to Profit: No new recommendation.
Here are some of my recent articles that you might enjoy:
Four IBD Top 50 Stocks on the Way Up


