With approximately half the S&P 500 stocks reporting, earnings are coming in much better than expected, so MoneyShow's Tom Aspray takes a technical look at the market averages to see if a move to new highs is likely before a pullback.
The stock market continued to power to the upside Tuesday with over 1% gains in the Dow Industrials and S&P 500. Once again, the small-caps were even stronger as the Russell 2000 gained over 2.8%.
Even the beaten energy stocks joined the party as the SPDR S&P Oil & Gas Exploration & Production ETF (XOP) was up 4.65% for the day. The Dow Transports made a new all time high as it closed well above the September highs.
With just about half of the S&P 500 stocks reporting, the earnings are coming in much better than expected. Before the start of the earnings, it was expected that earnings would only expand by 4.5% but, so far, they have expanded at a 6% rate.
The market internals were strong Tuesday with five times more stocks advancing than declining. The Friday, October 17 (see chart) short-term buy signals from the McClellan oscillator have been reinforced by the strong signals from the Advance/Decline lines.
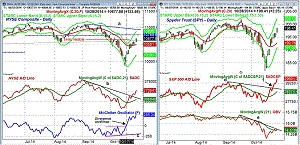
Chart Analysis: The NYSE Composite closed above the 61.8% Fibonacci resistance level at 10,638 on Tuesday.
- The quarterly pivot stands at 10,789 with the daily starc+ band at 10,885.
- The daily downtrend, line a, is at 10,940 with the early September high at 11,108.
- The bearish divergence resistance in the NYSE Advance/Decline line, line b, was overcome last Thursday.
- The A/D line is now rising sharply but is still below the September high.
- The McClellan oscillator has surged to the upside after confirming the divergence on October 17.
- The move from -212 to Tuesday's close at +255 is a sign of strength.
- There is short-term support now at 10,501 and the 20-day EMA.
The Spyder Trust (SPY) closed very near the day's high and closed well above the quarterly pivot at $196.17.
- The September 19 high is at $201.90 with the daily starc+ band at $202.13.
- The preliminary projected monthly pivot resistance for November is at $203.91.
- The S&P 500 A/D line formed a bullish zig-zag formation last week and closed Tuesday at a new all time high.
- The A/D line is clearly acting stronger than prices, which is a bullish sign.
- The daily on-balance volume (OBV) is still acting weaker than prices as it is just testing its downtrend, line e.
- The OBV is just barely above its WMA.
- There is first support at $194.75 with the rising 20-day EMA at $192.76.
Next Page: Two More ETFs to Watch
|pagebreak|The PowerShares QQQ Trust (QQQ) gained 1.51% on Tuesday and it is now up 15.21% YTD according to Morningstar.com.
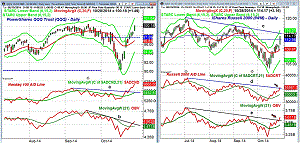
- The QQQ is now just below the September high at $100.56 with the daily starc+ band at $101.84.
- The quarterly projected pivot resistance is at $103.51.
- The Nasdaq 100 A/D line has moved well above the September highs.
- This confirms the break above the bearish divergence resistance, line c, on Tuesday, October 21.
- The A/D line is well above the now rising WMA.
- The daily OBV has overcome its negative divergence resistance at line b.
- The OBV is now well above its flattening WMA.
- The chart has initial support now at $197.80-$198.80 with the 20-day EMA at $97.16.
The iShares Russell 2000 (IWM) closed Tuesday well above the quarterly pivot at $112.95 with the downtrend, line c, at $114.90.
- The quarterly projected pivot resistance is at $116.58 with the early September high at $117.48.
- The Russell 2000 A/D line moved above its WMA on October 15.
- The A/D line has now broken through the downtrend from the early July highs, line d.
- The daily OBV has also overcome its longer-term resistance at line e.
- The weekly OBV is now just barely above its WMA.
- The daily and weekly relative performance are now above their WMAs.
- The chart has initial support at $112 with the rising 20-day EMA at $109.81.
What it Means: The Dow Jones Industrials A/D line also made a convincing new high on Tuesday, so only the NYSE A/D line is lagging prices. This cannot be ignored, so I am also watching the S&P 1500 A/D line, which is rising strongly but has also not yet made a new high.
I was looking for a mid-week pullback last Friday but the ability of crude oil to hold the $80 level on a closing basis and the strength in the energy sector is encouraging. A pullback is still a possibility if this afternoon's FOMC announcement has any surprises. This will be followed by the GDP report before the opening on Thursday.
However, the recent improvement in the daily market A/D lines does allow for a move to convincing new highs by the market averages before we get a decent pullback.
How to Profit: No new recommendation.


