Semiconductors have been hit hard and it’s been a tough time for short-term traders, so MoneyShow’s Tom Aspray studies the charts of several tech giants that have been holding up well to see if they may eventually succumb to the recent selling.
Stocks have continued to accelerate to the downside as the NYSE Composite has violated the April lows. The selling was wide spread with the Dow Transports losing over 2% and the S&P 500 down 1.65%. For a change, the small-caps did a bit better with the small-cap S&P 600 down just 0.25%.
The market is getting even more oversold, with the McClellan oscillator down to -222. It is still above the September 25 low of -244. Overseas markets are trying to stabilize as the futures are flat in early trading. The S&P 500 is now getting quite close the strong support in the 1850 area.
The Nasdaq 100 has been hit quite hard over the past few days as it has lost 5.5% since last Wednesday’s close. The selling has reached panic levels as rumors of hedge fund margin calls have not helped.
Citigroup (C), JPMorgan Chase (JPM), and Wells Fargo (WFC) are three of the big banks that report today. Reports before the opening are likely to set the tone for the opening. For investors, this is a scary time but has anything really changed on the outlook for the US economy? I made the case last Friday that—while the daily technical outlook was negative—the outlook for the economy was positive.
The semiconductors have been hit hard as a few of the market leaders have reversed after breaking out to the upside. Though the long-term outlook is still positive, this has been a tough time for short-term traders. Several tech giants are still holding up well, but will they eventually succumb to the recent selling? Let’s take a look.
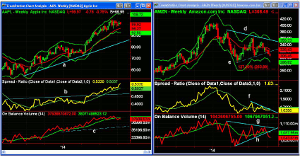
Chart Analysis: Apple, Inc. (AAPL) has stayed in a fairly tight range since the early September high of $103.74.
- There is short-term support in the $98.40 area with the monthly projected pivot support at $96.64. A decisive break below the $96 area could trigger a sharp decline to the $92.50 area and the starc- band.
- The weekly uptrend, line a, is in the $85 area.
- The weekly relative performance broke through resistance, line a, last spring.
- This indicated it was a market leader.
- The weekly OBV did drop below its WMA several weeks ago and is now flattening out.
- The daily OBV (not shown) has just dropped below its WMA.
- There is short-term resistance now at $102.40.
Amazon.com, Inc. (AMZN) peaked at $349.38 in early September and closed below the weekly support, line e, on Friday.
- This completes the bear flag formation (lines d and e) with the weekly starc- band at $286.80.
- The quarterly pivot support is at $270.37 with the 127.2% Fibonacci retracement target at $263.89.
- The weekly RS line is below its WMA and shows a pattern of lower highs, line f.
- The RS line has not yet broken to new lows for the year.
- The on-balance volume (OBV) has confirmed the price action by violating the support at line h.
- The OBV is now below its WMA, which is starting to turn lower.
- The daily OBV (not shown) is also negative.
- The quarterly pivot is at $330.63 and it represents strong resistance.
NEXT PAGE: 2 More Tech Stocks to Watch
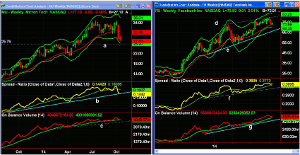
|pagebreak|Micron Technology (MU) completed its daily flag formation in late September and then pulled back to the support in the $32 area a week ago.
- Instead of bouncing from the support, which would have supported the positive outlook, prices plunged.
- MU is now not far above the major support in the $25.90 area, line a.
- This corresponds to the highs from early in the year.
- The relative performance made a new high three weeks ago before reversing to the downside.
- The longer-term uptrend, line b, is now being tested but it does not yet show a completed top formation.
- The daily RS line (not shown) dropped below its WMA on October 7.
- The weekly OBV is just barely holding above its WMA and the support at line c.
- The daily OBV is acting much weaker.
- There is initial resistance now in the $30 area with the declining 20-day EMA at $31.53.
Facebook, Inc. (FB) closed below the mid-September lows at $73.07 on Monday as the 20-week EMA is now being tested.
- There is further support in the $70 area with the quarterly projected pivot support at $67.60.
- The weekly uptrend, line e, is a bit lower in the $66 area.
- The weekly relative performance is trying to turn up from its rising WMA.
- The RS line is well above the support at line f.
- The weekly OBV did make a new high just three weeks ago and is well above its WMA.
- The OBV has more important support at line g.
- The daily chart shows that a doji was formed Monday with the daily OBV above its WMA.
- There is first strong resistance in the $75.50-$77 area.
What it Means: There has been some subtle deterioration in the technical outlook for Apple, Inc. (AAPL) and it could drop back to the $92-$93 area.
Amazon.com, Inc. (AMZN) looks quite negative after the completion of the flag formation. It confirms that the rally from the spring lows was just a rebound within the downtrend.
Daily flag formations are generally quite reliable chart formations but there was a false breakout in Micron Technology (MU). The only real clue was that the pullback from the highs should have been over a week ago but the failure of MU to turn higher was a sign of weakness.
Facebook, Inc. (FB) is still acting pretty well overall though panic selling could eventually hit FB as well.
How to Profit: No new recommendation.


