Many Wall Street pros follow the S&P 100, which is composed of the largest stocks in the S&P 500, so MoneyShow’s Tom Aspray examines the monthly, weekly, and daily technical studies to determine if any of the ten most oversold stocks in the index appear to be bottoming out.
The world markets started off the long weekend on a positive note with the German Dax closing the month 7.4% above the month’s lows. For the month, the Power Shares QQQ Trust (QQQ), which tracks the Nasdaq 100, was up 5% with the S&P 500 or Spyder Trust (SPY) up 3.8%.
The economic news last week was quite positive as the second quarter GDP was revised upward to 4.2% which beat analyst’s expectations. The strong 11.7% gain in second quarter earnings has validated the high stock prices and we have a full slate of data this week culminating with the jobs report on Friday.
The market internals remain strong, consistent with a better performance in September than most are expecting. The new weekly high in the NYSE Advance/Decline line reaffirms the market’s positive major trend.
The volume analysis is also now positive as the weekly as well as the monthly OBV (see Monday’s column) show no signs yet of a top. This does not rule out a pullback during the month but it should be a buying opportunity.
Many Wall Street pros follow the S&P 100 (OEX), which is composed of the largest, widely-held stocks in the S&P 500. All of the stocks are option able and the OEX options are very liquid.
The monthly starc band analysis of the stocks in the S&P 100 identifies some of the stocks that have not yet rallied with the market. Those stocks that are closest to their starc- band can then be evaluated for new buying opportunities. Of course, these stocks can become even more oversold as the bands typically contain approximately 92% of the price activity.
McDonald’s Corp. (MCD) closed the month just 4.9% above its monthly starc- band and is 14.7% below its starc+ band. Of course, MCD has become one of the least favored large-cap stocks and, since the end of 2011, it is down 6.6%. Some are even recommending that it be sold short. Of course, the nearness to the starc- band makes it a high risk sell.
In reviewing the ten most oversold stocks in the OEX, I take a careful look at the monthly, weekly, and daily technical studies to determine if any appear to be bottoming out.
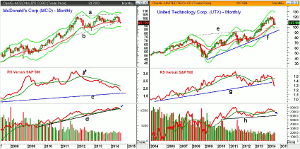
Chart Analysis: I have commented on the monthly chart of McDonald’s Corp (MCD) several times in the past year as it was my view that the trading range of the past few years was just a pause in the uptrend.
- It was one of my favorite stocks in 2011 when it gained 34% and the S&P 500 was flat.
- The August close below the 20-month EMA and support at line b, has now weakened the technical outlook.
- For October, the projected monthly pivot support is at $90.89.
- A decline below the November 2012 low of $83.32 would complete a longer-term top formation.
- The monthly relative performance dropped below its WMA in April 2012 when MCD closed at $97.45.
- The weekly RS analysis (not shown) turned positive in April but reversed to negative in May as MCD was topping out above $100.
- The monthly on-balance volume (OBV) closed below its WMA in August confirming the negative signal from the weekly OBV in July.
- There is near term resistance at $96 with the quarterly pivot at $98.96.
United Technologies Corp. (UTX) is down 6.6% in the past three months and has lost 3.5% YTD. It is currently down 10.5% from its 52-week high. Like MCD, it has an attractive yield near 2.2%.
- The monthly chart analysis shows that UTX is still well above the major support and the breakout level (line e) at $98.40.
- The monthly relative performance has been below its WMA since May.
- The uptrend, line g, has been broken with key support now at the mid-2013 lows.
- The weekly RS line (not shown) peaked in the middle of May and is still negative.
- The OBV moved back above its WMA in August, generating an AOT buy signal.
- The monthly OBV has major support at line h.
- The weekly OBV is still below its WMA.
- The August close was above the 20-month EMA with the monthly pivot at $106.96.
- There is initial resistance now at $110 with quarterly pivot resistance in the $111.30-$112 area.
NEXT PAGE: Two More Widely-Held Stocks in the Index to Watch
|pagebreak|Colgate-Palmolive Co. (CL) triggered a monthly LCD in July and is trading 7.7% below its 52-week high. The stock is up less than 1% YTD.
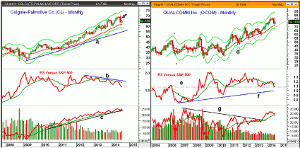
- The stock is, so far, holding well above the 20-month EMA at $60.74.
- The monthly projected pivot support for October is at $61.63.
- The long-term uptrend that goes back to the 2009 lows is now at $54.40.
- The monthly relative performance has been diverging from prices since the middle of 2012.
- The weekly RS line (not shown) also shows a pattern of lower lows.
- The monthly OBV turned up from its WMA last month as CL closed higher.
- The weekly OBV is also now above its WMA but the daily is slightly negative.
- There is initial resistance at $65.83 and the 20-week EMA with the quarterly pivot at $66.71.
QUALCOMM, Inc. (QCOM) is 7.16% below its 52-week high of $81.97 but is still up over 4% for the year.
- The rising 20-month EMA was tested with last month’s low at $71.42.
- For September, the monthly pivot is at $74.80.
- The monthly chart shows that QCOM is still in a solid uptrend, line d.
- The monthly RS line is below its WMA and is now testing more important support at line e.
- The weekly relative performance dropped below its WMA at the end of May.
- The monthly OBV broke its major downtrend, line g, in August 2013 when QCOM closed at $66.28.
- The OBV turned up from its rising WMA in August.
- The weekly OBV (not shown) tested its WMA two weeks ago and could generate a buy signal this week.
- The daily studies are slightly positive now so any pullback should be watched closely.
- Once above the August 21 high at $76.88 there is next resistance at $77.68 to $78.50 which is the quarterly pivot.
What it Means: All four of these stocks yield over 2% but that is not enough of a reason to buy McDonald’s Corp. (MCD) at this time. It was recommended in April but was closed out for a 1.7% profit when the technicals deteriorated.
The AOT buy signal in United Technologies Corp. (UTX) is an encouraging sign but I would wait until the daily relative performance suggests it is a market leader.
The long-term chart of Colgate-Palmolive Co. (CL) is clearly positive but the recent narrow range does allow for another push to the downside. That, and the mixed signals from the weekly RS and OBV analysis, is keeping me on the sidelines for now.
The best looking of the group is QUALCOMM, Inc. (QCOM) and a pullback to the mid-August support would allow for using a stop under the January lows.
How to Profit: For QUALCOMM, Inc. (QCOM) go 50% long at $74.68 and 50% long at $71.77 with a stop at $69.56 (risk of approx. 5%).


