A rally in the stock market over the next week or so is likely to go further and last long enough to cause a transitory shift in short-term sentiment, so MoneyShow’s Tom Aspray takes to the charts to determine what the investor or trader should do if the market sees a sharp rebound.
Despite the mixed close in the major averages, Dow Industrials (+0.085), Dow Transports (-0.62%), S&P 500 (0.00%), Nasdaq 100 (-0.02%), and S&P 600 (+0.25%), there were signs that a short-term bottom is forming.
The market internals were positive but the A/D indicators have still not recovered from last week’s heavy selling. As I discussed in yesterday’s column, a rally over the next week or so is likely to go further and last long enough to cause a transitory shift in the short-term sentiment.
The Euro zone markets are trying to stabilize early Thursday despite Italy’s GDP numbers that suggest it may be slipping back into a recession. The US futures are trading higher in early trading but it is the close today that will be important. The September S&P futures formed a doji Wednesday so a daily close above 1923.50 will trigger a high close doji buy signal.
So, what should the investor or trader do if the market does see a sharp rebound?
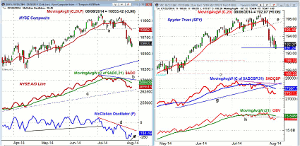
Chart Analysis: The NYSE Composite was just slightly lower yesterday but it is down just over 4% from the July 3 high.
- The NYSE is currently trading below its quarterly pivot at 10,758 as it was violated on a weekly closing basis last Friday.
- The weekly starc- band is at 10,533 with the quarterly S1 support at 10,491.
- The daily NYSE Advance/Decline line is still holding above its long-term support at line c.
- On a short-term basis, the A/D line has initial resistance at its declining WMA.
- There is stronger resistance at the downtrend, line b, and the late July high.
- A move above both of these levels is needed to signal that the worst of the selling is over.
- The drop in the McClellan oscillator below support in early July was a sign of weakness.
- The oscillator does show a short-term positive divergence (see arrow) with next resistance at line d.
- This is typical of a rebound but longer-term divergences that develop over several weeks are generally seen at more important bottoms.
- For the NYSE, initial resistance at 10,750 with the monthly pivot at 10,852, which is just below the declining 20-day EMA at 10,862.
The Spyder Trust (SPY) has tested its quarterly pivot at $191.24 over the past two days.
- The daily starc- bands have also been tested and are now at $190.03.
- The 38.2% Fibonacci retracement support from the February lows is at $188.23.
- The weekly starc- band is just a bit higher at $188.61.
- The 50% support is at $185.21 and a drop between these support levels is possible before the market’s correction is over.
- The S&P 500 A/D line’s divergence at the July 24 highs, line f, warned of the market’s weakness.
- The divergence was confirmed by the drop below the A/D lines support at line g.
- There is converging resistance for the A/D line now at lines f and g.
- The on-balance volume (OBV) dropped below support at line h, and is now below its declining WMA.
- There is initial resistance at $193.60-$194.30 with the declining 20-day EMA at $195.48.
- There is even stronger resistance now in the $196.60-$197 area.
NEXT PAGE: Two More ETFs to Watch
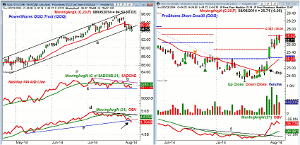
|pagebreak|The PowerShares QQQ Trust (QQQ) closed below the daily uptrend, line a, on Wednesday.
- The monthly projected pivot support is at $93.26 with the quarterly pivot at $90.37.
- The 20-day EMA is at $95.39 with the short-term swing high at $95.69.
- There is further resistance at $96.52-$97.20 and the daily starc+ band.
- The Nasdaq 100 A/D line also formed a negative divergence, line b, at the recent highs.
- It is a positive sign that the A/D line is still holding above the key support at line c.
- The daily OBV is acting weaker as it also diverged from prices at the highs, line d.
- The OBV has dropped below its uptrend, line e, and now shows a clear pattern of lower highs.
- The OBV could move back to its declining WMA on an oversold rally.
- The weekly OBV (not shown) is still above its declining WMA.
The Proshares Short Dow30 (DOG) is a single inverse ETF that tracks the Dow Industrials. Last week the Dow was looking weaker than either the S&P 500 or Nasdaq 100 so it was recommended by Tweet on July 30.
- The daily chart shows that the monthly projected pivot resistance at $25.82 was tested over the past two days.
- The 38.2% Fibonacci retracement resistance from the February high of $28.11 is at $26.
- The quarterly projected pivot resistance is at $26.28 with the 50% resistance level at $26.41.
- The volume has declined over the past few days suggesting that, on a short-term basis, the rally was losing momentum.
- There is initial support now at $25.50 with the monthly pivot and 20-day EMA at $25.23.
- The daily OBV surged through resistance, line f, early last week.
- It has since rallied sharply and is well above its rising WMA.
- The weekly OBV (not shown) is also now above its WMA and appears to have bottomed.
What it Means: A strong close either today or tomorrow will be consistent with an oversold rally that could carry into next week. Though there are no signs that the market has bottomed the Nasdaq 100 and PowerShares QQQ Trust (QQQ) have the potential to make new rally highs.
At this point, this is unlikely in the S&P 500 or Spyder Trust (SPY).
On the next decline, it is the high momentum stocks like those discussed in Are IBD's Top Four Looking Toppy? that could bear the brunt of the selling. If you are in some of the stocks that have double digit gains over the past month, would consider taking some profits or, at least, partially hedging your position.
I will be watching the rally closely and may recommend another inverse ETF for traders like the ProShares UltraShort S&P 500 (SDS) if we get another low risk buying opportunity like last week.
How to Profit: No new recommendation.
Portfolio Update: Traders were long the ProShares Short Dow30 (DOG) at $25.14 or better and I Tweeted a recommendation to sell yesterday that should have been filled at around $25.72.


