Currently, there are a number of stocks in the high risk buy area, so MoneyShow’s Tom Aspray takes to the charts to examine some of the most vulnerable ones where investors may want to consider protecting their profits.
The late night rescue plan for embattled Portuguese Banco Espirito Santo seems to have calmed the Euro zone markets as all are higher. The technical outlook for the DAX is still negative so any bounce over the near term is likely to be followed by lower lows. The US futures are also up in early trading.
This morning’s slight increase in Euro zone producer prices and sharp increase in the UK’s homebuilding rate should help calm the markets. The extremely one-sided A/D ratios last Thursday make a sharp oversold rally likely this week and the action of the bond market on such a rally will be important.
Tuesday’s Market data on China’s manufacturing could be the catalyst to embolden the stock market bulls and make those on the short side nervous.
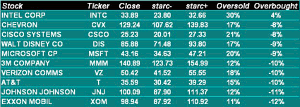
The monthly starc band analysis of the stocks in the Dow Industrials reveals that many are still quite vulnerable as several are trading close to the starc+ bands, which means they are in a high risk buy area.
Leading the list is Intel Corp. (INTC) which closed July at $33.89, which was 4% above its monthly starc+ band. Before the market’s correction is over, I expect even the strongest stocks—like INTC—to also likely be hit by profit taking.
There are several other stocks on the ten most overbought list that look even more vulnerable technically basis both the monthly and weekly charts. Let’s look at some of the stocks where investors may want to consider protecting their profits.
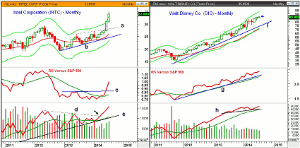
Chart Analysis: Intel Corp. (INTC) is up 31.7% YTD and up 28.4% in just the past three months.
- INTC also closed above its monthly starc+ band in June.
- This has not happened since February 2000 when INTC continued higher for another five months before a top was completed.
- In 1999, two monthly closes above the starc+ band were followed by a five month correction back to the 20-month EMA.
- INTC did exceed the quarterly R2 resistance at $34.68 last week.
- The monthly pivot is at $33.05 with the monthly projected pivot support at $31.28.
- The weekly starc- band is at $30.29 with the rising 20-week EMA at $29.40, which is a potential downside target.
- The monthly relative performance completed its bottom formation in June as resistance at line c was overcome.
- The monthly OBV broke through its resistance, line d, at the end of March when INTC closed at $25.81.
- The weekly studies are all positive but INTC has been trading above its starc+ band for the past three weeks.
Walt Disney Co. (DIS) has also beat the S&P 500 this year as it has gained 11.75% with a three month gain of 8.72%.
- Though DIS closed July 9% below its WMA, it did form a doji as it opened July at $85.81 and closed at $85.88.
- A monthly close below $84.87 in August will trigger a low close doji sell signal.
- The rising 20-week EMA is at $82.75 with the quarterly pivot at $82.71.
- The June’s low was $81.90 with the quarterly projected pivot support at $79.34.
- The relative performance made a new high last month and is well above its rising WMA.
- The monthly on-balance volume (OBV) confirmed the new highs in July.
- There is first important OBV support at line h, and the rising WMA.
- The weekly OBV also confirmed the recent highs but turned lower last week.
- There is initial resistance at $86.80-$87.20 with monthly projected pivot resistance at $88.89.
NEXT PAGE: Two More Vulnerable Stocks to Watch
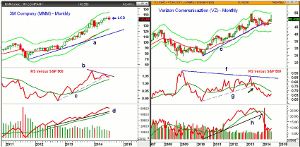
|pagebreak|3M Company (MMM) has been weaker than the S&P 500 this year, up just 1.12%. It has rallied 14.8% from the February low of $122.05.
- In July, MMM came fairly close to the monthly projected pivot resistance at $148.68.
- With the July close below June’s doji low of $141.61, a LCD sell signal was triggered.
- The monthly projected pivot support at $131.85 was approached last week.
- The quarterly pivot support stands at $134.46 with the 50% retracement support at $134.03.
- The 20-month EMA is at $124.39 with the starc- band at $123.73.
- The relative performance formed lower highs, line b, as prices were peaking.
- This divergence has been confirmed by the break of the uptrend, line g.
- The monthly OBV did make new highs with prices and is still well above its WMA.
- There is further support at the uptrend, line d.
- There is initial resistance in the $143-$143.60 area.
Verizon Communication (VZ) spiked to a new high at $53.66 on July 29 but then closed near the day’s lows.
- This high was well above the quarterly projected pivot resistance at $52.28.
- The close last week was below the prior swing support at $50.74.
- The quarterly pivot is at $47.85 with the monthly projected pivot support at $47.93.
- The still rising 20-month EMA is at $47.53.
- The RS line has formed lower highs, line f, going back to early 2009.
- The break of the uptrend, line g, in July 2013 indicated it was no longer a market leader.
- The OBV is still well below its WMA as it appears to be leading prices lower.
- The OBV support, at line h, was broken at the end of January and volume surged in February.
- The monthly pivot and first resistance is at $40.79 with further resistance at $41.50.
What it Means: The technical warnings were the “Real Reason” for the Market’s Plunge and a 1-3 day rebound will not change the negative near term outlook. It would take several 4-1 days of positive A/D ratios to change the short-term outlook. The new highs in the NYSE A/D line in July still means the longer-term trend is still positive.
The most overbought stocks are also those that have been heavily recommended in the past six weeks and following the crowd can often be dangerous.
Only Walt Disney Co. (DIS) is a holding of the Charts in Play portfolio and would look to sell half the position on a bounce and tighten the stop to lock in a nice profit.
How to Profit: No new recommendation.
Portfolio Update: For Walt Disney Co. (DIS) should be long at $77.73. Raise the stop to $84.76 and sell half at $86.16 or better.


