It is important for bond holders to examine the risk of their bond ETFs and funds, so MoneyShow's Tom Aspray takes to the charts to determine if several key bond ETFs reveal new opportunities that would benefit from higher bond yields.
The stock market's seemingly neutral performance on Wednesday-in spite of the surprisingly strong GDP numbers-masked further technical deterioration. The Asian markets were mixed but the European markets are generally lower. The futures are showing sharp losses in early trading with the Dow futures down 90 points.
A lower daily close on Thursday will trigger stronger sell signals and a weekly close in the S&P futures below 1959 will trigger a weekly low close doji sell signal. The sagging action in the stock market after the FOMC announcement shifted the market scales to the sell side, as was discussed Wednesday. This was the reason I Tweeted a recommendation for traders to buy an inverse ETF, the ProShares Short Dow30 (DOG).
There was also some important action in the bond market as yields reversed to the upside. Last week, I noted that the yield on junk bonds had broken their downtrend (see chart). Recent data from Lipper reports outflows of $2.4 billion from high yield bond funds. This is similar to what occurred in May 2013 as yields completed a significant bottom formation.
This makes it important that bond holders examine the risk of their bond ETFs and funds. A look at some of the key bond ETFs does reveal some new opportunities that would benefit from higher bond yields.
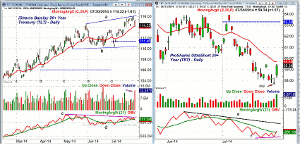
Chart Analysis: The iShares Barclay 20+ Year Treasury (TLT) made a marginal new high Tuesday at $116.07 as a doji was formed.
- The close Wednesday triggered an LCD sell signal and monthly projected pivot resistance at $115.31 was exceeded in the past week.
- The 20-day EMA at $114.14 is now being tested with August pivot at $113.58.
- The quarterly pivot is at $111.40 with further chart support at $110.34, line b.
- There is longer-term support in the $106-$108 area.
- The volume spiked Wednesday to 12 million shares.
- The on-balance volume (OBV) shows a longer-term bearish divergence, line c, as it made lower highs in contrast to prices (line a).
- The OBV is now below its WMA but a decline below the support, at line d, is needed to confirm the divergence.
- There is initial resistance in the $115-$115.38 area.
The ProShares UltraShort 20+ Year (TBT) formed a doji on Tuesday and Wednesday's close at $59.34 was well above the doji high.
- Therefore, a high close doji buy signal was triggered.
- The 20-day EMA at $59.69 is still declining with August's pivot at $60.29.
- The quarterly pivot is at $63.30 with the 38.2% Fibonacci resistance from the August 2013 high at $67.17.
- The daily OBV did form a bullish divergence, line f, at the recent lows.
- The OBV is now back above its WMA with major resistance at line e.
- The weekly OBV (not shown) has turned up but is still well below its declining WMA.
- There is initial support now at $58.70-$59.10.
- The doji low was $57.61 and a decisive drop below this level would reverse the HCD buy signal.
NEXT PAGE: Two More Bond ETFs to Watch
|pagebreak|The ProShares Ultrashort 7-10 Year Treasury (PST) is a double inverse ETF that has an average daily volume of 80K shares.
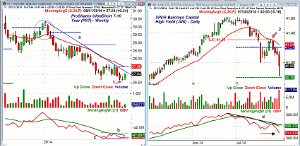
- The weekly chart shows that it formed a doji last week (point 1) and a close above $26.90 on Friday will trigger a HCD buy signal.
- The declining 20-week EMA and quarterly pivot are in the $27.50 area.
- The high in April was $28.84 which was just below the 2nd quarter pivot at $28.88.
- PST formed a doji the first week of 2014 with a high of $30.35 and an LCD was triggered the next week (see circle).
- The weekly OBV did not make new lows last week (line c) so it may be forming a bullish divergence.
- A move in the OBV above the resistance at line b, will confirm the divergence.
- Initial support now at $26.80-$27 with stronger at $26.70.
The SPDR Barclays Capital High Yield Bond (JNK) is very similar to the iShares iBoxx High Yield Corporate Bond (HYG) that I mentioned in Monday's 4 Quarterly Pivot Sell Signals.
- JNK also closed last Friday below its quarterly pivot at $41.21.
- The rebound last week just slightly exceeded the 50% Fibonacci retracement resistance at $41.31.
- JNK made new correction lows Wednesday and came close to the quarterly projected pivot resistance at $40.79 (Analysis courtesy of John Person's software).
- There is next strong resistance in the $40-$40.20 area.
- The volume Wednesday was the heaviest since April.
- The daily OBV just barely made it above its WMA last week triggering an AOT sell signal.
- The OBV has now made further new lows, confirming the price action.
- The weekly OBV is still barely above its WMA.
- There is initial resistance at $41.25.
What it Means: The stock market's close will be quite interesting as, if the early selling can be well absorbed again, it would be a positive sign. Intra-day traders should watch the A/D ratios closely.
As for the bond market, it would take a close in TLT back above $116 to reverse the negative technical signals and the inverse bond ETFs are recommended.
How to Profit: For ProShares UltraShort 20+ Year (TBT) go 50% long at $59.58 and 50% at $59.02 with a stop at $57.37.
For ProShares Ultrashort 7-10 Year Treasury (PST) go 50% long at $27.06 or better and 50% at $26.88 with a stop at $26.37.
Portfolio Update: As per yesterday's Tweet, traders should be long the ProShares Short Dow30 (DOG) at $25.14 or better with a stop at $24.29.
Related Reading
What Will Tip the Scales?
4 Quarterly Pivot Sell Signals
The Week Ahead: Bond Market Mystery Solved
Finding High-Probability Entry Levels
OBV: Perfect Indicator for All Markets


