Given the current market environment—with many stocks being pushed lower—some traders are looking at the worst performers for buying opportunities, but MoneyShow’s Tom Aspray takes a technical look at four industry groups that are the worst performers YTD to determine if they’re worth buying.
Stocks managed a nice recovery on Wednesday and the FOMC minutes helped stocks close on a firm note. The small-cap indices, like the Russell 2000 had the smallest gains, up just 0.14%. A better performance by these more speculative stocks would have been a more positive sign.
The daily technical studies for the Powershares QQQ Trust (QQQ) have turned higher from support. Another higher daily close is required to indicate that the market’s pullback is over. Given the early market action, this does not look likely.
The Euro zone markets are all lower in early trading, as a drop in German Industrial Production and increased deflationary fears are pushing stocks lower. The US stock index futures are sharply lower in early trading but it will be the close that is more important.
The US stock market has surprised many and the top performing industry group has been the DJ US Aluminum Index, which is up 36.3%. In this type of environment, some traders start looking at the year’s weakest industry groups and stocks for new buy candidates.
These four industry groups are the worst performers YTD, according to Bigcharts.com, but should any of them be considered for new buying?
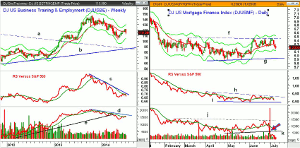
Chart Analysis: The DJ US Business Training & Employment (DJUSBE) is made up of stocks like Linkedin Corp. (LNKD) and Monster Worldwide (MWW).
- The index peaked last October at 146.80 and declined steadily to the early May low of 103.58. It is down just over 15% YTD.
- This was a decline of 29.4% from the highs and it has recently had a double digit bounce.
- The recent rally appears to have stalled at the 20-week EMA with the 50% Fibonacci retracement resistance at 125.
- The weekly starc+ band and the 61.8% resistance are now in the 129.50-130 area.
- The relative performance dropped below its WMA last November and is still in a well defined downtrend, line c.
- The RS line looks ready to close the week back below its WMA.
- The OBV also dropped below its WMA last week and, by early 2014, was in a new downtrend.
- The OBV support, line d, was broken in early April as it has formed lower lows and lower highs.
- There is initial resistance now at 121.68.
The DJ US Mortgage Finance Index (DJUSMF) has lost just under 11% so far this year. It includes Fannie Mae (FNMA) and Freddie Mac (FMCC).
- The daily chart shows that after the January drop, the index has been in a trading range, lines e and f.
- There were three attempts to push above the 6.50 area before the index turned lower.
- The drop back below its 20-day EMA suggests a test of the daily starc- band in the 6.10 area.
- There is further support now at 5.92, line f.
- The sideways pattern in the relative performance (lines g and h) is consistent with an industry group that is lagging the overall market.
- The trading range in the OBV has already been completed as it dropped below support (line j) at the end of June.
- This suggests that the index may soon also drop to new correction lows.
NEXT PAGE: 2 More Indices to Watch
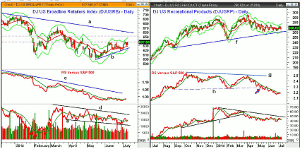
|pagebreak|The DJ US Broadline Retailers Index (DJUSRB) is down 8.9% so far in 2014 but has been helped by double digit gains in Big Lots, Inc. (BIG) and Sears Holdings Corp. (SHLD).
- Well known names like Amazon.com, Inc. (AMZN) and Macy’s (M) are also part of this index.
- On the daily chart, the downtrend, line a, goes back to the December high of 702.80.
- The rally from the May low of 599.78 has just reached the 38.2% Fibonacci retracement resistance.
- The daily starc+ band is at 648 with the 50% resistance level at 651.
- So far, the rally looks like just a pause in the downtrend with near term support at 624.60 (line d).
- A drop below 622.80 will set the stage for a decline to the May lows.
- The daily relative performance is trying to hold above its WMA but is still well below its downtrend, line c.
- The daily OBV is locked in a downward trading channel, lines d and e.
- The OBV has just moved above its WMA but needs another positive close to turn positive.
The DJ US Recreational Products (DJUSRP) is down just over 7% YTD and therefore is lagging the Spyder Trust (SPY) by over 14%.
- Nautilus, Inc. (NLS) is one company that has bucked the trend as it is up over 23% while Calloway Golf Co. (ELY) is down 11.2%.
- The chart shows what may be a double top as it peaked in December 2013 and made marginal new highs in April.
- The chart has trend line support in the 261 area.
- A close below the February low of 246.57 would complete the top formation.
- The relative performance has already completed its top formation as it formed lower highs in April (line g).
- This divergence was confirmed by the break below support at line h.
- The daily on-balance volume (OBV) dropped below support, line i, in late March, just before the index made its high.
- This confirmed the bearish divergence, line j, that formed at the April highs.
- There is near term resistance in the 275-277 area with stronger at 285-286.
What it Means: Though it is always good to monitor the weakest sectors and industry groups for signs of a bottom, one needs to have strong technical evidence before buying.
There are no signs yet that any of these groups are bottoming but further improvement in consumer sentiment and spending makes the DJ US Broadline Retailers Index (DJUSRB) a group to watch.
A close in the major averages below Tuesday’s lows will weaken the technical outlook but it could lead to an oversold low in the next few days.
How to Profit: No new recommendation.


