Since his regular analysis focuses primarily on the weekly or daily OBV, MoneyShow's Tom Aspray offers a longer-term OBV analysis for two key ETFs, which can be helpful in confirming a new trend or warn when a trend may be changing.
More new highs this week for the major averages as the market has started off July on a positive note. In my daily columns, I generally focus on the weekly and daily volume using my favorite volume indicator, the On Balance Volume.
In my monthly starc band analysis of the stocks in the Dow Industrials, I place quite a bit of emphasis on the monthly OBV as it often will lead prices higher. This, combined with positive relative performance analysis and keying on monthly support, can often create good opportunities.
The quarterly OBV analysis can also be helpful in confirming a major trend as well as warning one when a trend may be changing. As we end the quarter and month, I thought it was time to take a longer-term OBV analysis of these two key ETFs.
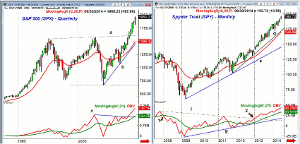
Chart Analysis: The quarter chart of the S&P 500 shows the higher highs over the past six quarters.
- The resistance from the 2000 and 2007 highs, line a, was overcome in the second quarter of 2013.
- The quarterly pivot is at $191.21 (see table) with R1 resistance at 2068.
- The quarterly starc+ band is at 2073.
- There is initial quarterly support at $1814 with more important at $1738.
- The 20-quarterly EMA is at $1496 with the uptrend (line a) at 1435.
- The quarterly OBV dropped, stayed in a trading range during 2011-2012, and moved strongly above the multi-year resistance at line c.
- The OBV is well above its rising WMA and could be considered a bit overextended.
- The quarterly OBV dropped below its WMA in June 2008.
The monthly chart of Spyder Trust (SPY) shows the five higher closes since January’s lower close.
- The May open at $188.22 and the April close at $188.31 now represent first good monthly support.
- The initial monthly uptrend (line d) is now at $174.31 with the 20-month EMA at $169.86.
- The longer-term uptrend, line d, is in the $145 area.
- The monthly OBV dropped below its WMA (point 1) in early 2008, which was a negative sign.
- The OBV moved above its WMA in August 2009.
- It formed a bullish zig-zag formation in the latter part of 2012.
- It then broke through major resistance (line f) in January 2013 (point 1).
- The OBV has continued to confirm each new high of the SPY including in June.
- The OBV is well above its WMA so a pullback is possible over the next few months.
- The major OBV support (line g) is well below current levels.
NEXT PAGE: Another Important ETF to Watch
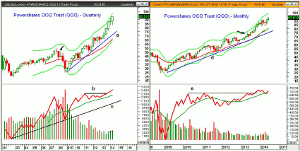
|pagebreak|The PowerShares QQQ Trust (QQQ) has tested its quarterly starc+ band for each of the past three quarters and, for the third quarter, is at $97.55, which is very close to the quarterly R1 resistance at $97.61.
- The support from the last two quarter lows is at $83.39-$83.28.
- The uptrend that goes back to the 2008 lows, line a, is now at $78.87.
- The OBV held the support from the 2003-2005 period during the 2008 bear market.
- A quarterly LCD was triggered at the end of March 2008.
- The OBV moved back above its WMA at the end of June 2009.
- The OBV consolidated from March 2011-2013 when it broke out to the upside (line b).
- The OBV has long-term support at line c and did confirm the quarterly highs.
The monthly chart of the PowerShares QQQ Trust (QQQ) shows that it broke out of its continuation pattern at the end of May 2013 when it closed at $72.94.
- The monthly starc+ band for July is at $78.79.
- From the monthly charts there is support at $85.53 to $83.28.
- The monthly starc- band and 20-month EMA are now in the $83.40 area.
- The monthly OBV broke through major resistance, line e, at the end of October 2013 when it closed at $82.44.
- The OBV moved back above its WMA at the end of May triggering an AOT buy signal.
- The QQQ is up 9.1% YTD in 2014 after a 26.6% gain in 2013.
What it Means: Though the daily chart of the PowerShares QQQ Trust (QQQ) does show some loss of upside momentum, as discussed in Is the Nasdaq 100 Looking Toppy?, the quarterly and monthly OBV shows no signs of a top.
The outlook for the S&P 500 and the Spyder Trust (SPY) is also positive basis the long-term volume analysis. I would expect to see the monthly OBV top out before we see another bear market.
How to Profit: No new recommendation.


