Given that the stock market is often choppy during the summer, MoneyShow's Tom Aspray takes a technical look at several of his recent portfolio hits and misses and offers several stocks that may offer favorable risk/reward profiles to carry investors and traders through the next few months.
The stock market saw its first significantly lower close Tuesday in quite some time, despite some encouraging economic data. The 18.6% surge in New Home Sales was so far above expectations that many immediately concluded it was an aberration. The next reading on July 24 should provide further insight.
More important from my perspective was the 85.2 reading on Consumer Confidence as the optimistic trend seems to be growing. The consumer sectors held up well, while the homebuilders (that were discussed yesterday) closed with nice gains as the iShares Dow Jones Home Construction ETF (ITB) gained 0.87%.
As we enter the tough summer months, when the stock market is often choppy, one needs to be sure that your portfolio strategy matches your temperament. For those who want to be invested but take a lower stress approach, the well diversified ETFs recommended in A Portfolio That Won't Ruin Your Summer are still the best bets.
The advance/decline numbers weren't that negative Tuesday and the long-term outlook for stocks is positive, which favors high prices at year's end. Overseas markets are lower in early trading and we could see more selling over the near term, but there are no signs yet of a short-term top.
The summer months also can provide some good opportunities and, while individual stocks have a higher risk, they also have a higher potential return. Some stocks, like those recommended in Monday's 3 Bottoming Stocks in a Strong Market, appear to have favorable risk/reward profiles. Let's look at some of the recent portfolio hits and misses.
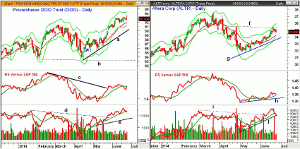
Chart Analysis: The PowerShares QQQ Trust (QQQ) has had quite a run since the panic April 15 low of $83.06. A daily LCD was generated the following day.
- New long positions were recommended on April 25 as I was looking for a pullback after a sharp six day rally.
- The initial buy level at $86.88 was hit as I was using a stop well under the important support at line b.
- The relative performance moved above its WMA on May 15, a few days before the QQQ cleared important resistance that confirmed a low was in place.
- The RS line subsequently broke its downtrend, line c.
- In Tuesday's session, the QQQ held up well and the RS line is just barely above its WMA.
- The OBV bottomed two days ahead of prices and moved above its WMA a day after the lows.
- The move through OBV resistance at line d was a positive sign and it did confirm the recent highs. Good OBV support at line e.
- On the upside, there is quarterly pivot resistance at $95.04.
- There is initial support now in the $92.50-$91.70 area.
Altera Corp (ALTR) was recommended in early June's portfolio review and it just reached the April 25 high (line f) and the daily starc+ band last week.
- There is further resistance at $36.99 with the quarterly pivot resistance at $38.72.
- The rising 20-day EMA is at $34.29 with further support in the $33.40-$33.80 area.
- The daily relative performance shows a completed short-term bottom formation, line h.
- The weekly RS line (not shown) is still just below its WMA.
- The daily OBV has been acting stronger than prices since early May as it overcame resistance at line i.
- The OBV did confirm the recent highs, though the volume was heavy last Friday.
- The uptrend in the OBV, line j, is now being tested.
- The weekly OBV (not shown) has moved above the March highs and is acting stronger than prices.
NEXT PAGE: 2 More Stocks to Watch This Summer
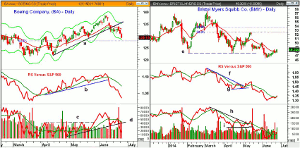
|pagebreak|Boeing Company (BA) has been hit hard since it made a high of $138.39 on June 9. It is now down 10.67% from its high. One of the catalysts appears to have been the cloudy future of the Export-Import Bank after Eric Cantor's primary loss.
- The daily uptrend, line a, was broken on June 12.
- After six days of sideways action, BA was hit with another wave of selling as it is now close to the daily starc- band.
- The short-term 61.8% Fibonacci retracement support is at $127.61.
- The relative performance did confirm the recent highs before dropping sharply below its WMA.
- The uptrend, line b, was broken on June 11 and it has declined further since then.
- The daily on-balance volume (OBV) completed its bottom in May as resistance, at line c, was overcome.
- The OBV did confirm the highs before it dropped sharply.
- The weekly OBV (not shown) also confirmed the highs but it may close below its WMA this week.
- There is initial resistance now at $132.75, which is the monthly pivot.
Bristol-Myers Squibb Co. (BMY) showed up in a weekly scan in early May but the stock reversed to the downside the following week.
- Soon after our buy level at $50.88 was hit, it surged to a high $52.49.
- The rally reversed at this 50% retracement resistance level and then dropped back to the recent lows.
- BMY tried to rally in early June before dropping below the stronger support at line e.
- The relative performance tried to bottom in April, line g.
- The RS line broke its downtrend, line f, before violating its lows in May.
- The OBV shows a similar formation as it also showed a potential bottom (line i).
- So far, BMY has held above monthly projected pivot support at $45.72. But the rally stalled as it then reversed.
- There is strong resistance now in the $50 area.
What it Means: For the PowerShares QQQ Trust (QQQ), which gives broad tech exposure to the portfolio, I tend to keep the stops wide unless I see signs of a deeper and more sustained correction. The same strategy that is being followed in the Spyder Trust (SPY).
This is the strategy I use for most of the ETFs, though I will take some profits if they get overextended. For those who want to take a more active approach, I suggest you use the quarterly pivot resistance levels or weekly starc+ bands to determine profit taking levels.
The bullish weekly OBV analysis on Altera Corp. (ALTR) also favors giving this position some room, though I will be watching its next rally closely.
As for Boeing Company (BA) I considered it to be longer-term position because of its yield and bullish monthly chart but it looks as though I may have given up too much of my profits.
As for Bristol-Myers Squibb Co. (BMY) the longs were stopped out for a 2.9% loss as the risk was well controlled.
The summer challenge for the individual investor or trader is to determine what type of stop loss management strategy you will use before you establish a new position. Too many do not make this decision until after the position is established. Stay in touch with my Twitter feed for updates.
How to Profit: No new recommendation
NEXT PAGE: The Charts in Play Portfolio
|pagebreak|


