MoneyShow’s Tom Aspray has always been a staunch advocate of controlling risk in one’s portfolio, as well as reviewing holdings regularly, so here he reviews the model portfolio to illustrate how he manages its positions.
The stock market treaded water Tuesday as the S&P 500, Nasdaq 100, and Dow Industrials showed minor losses but the Transports were hit a bit harder. On the plus side the utilities, banks, oil services, and semiconductors did pretty well.
The market internals were negative and the McClellan oscillator has dropped back to -12 while the daily OBV on the S&P 500 and NYSE Composite are close to new highs. The markets are bracing for a heavy slate of economic news over the next three days with the ADP Employment report and ISM Non-Manufacturing Index this morning followed by the Beige Book this afternoon.
Thursday, we have the widely anticipated ECB decision on rates followed by the monthly jobs report on Friday. As I noted last week, the major averages have been in the non-trending mode for most of 2014 but the daily ADX analysis suggests that may be changing for the Spyder Trust (SPY).
Over the years, I have continued to focus on risk control and that is especially true in non- trending markets. Though the ETFs that track the major averages do not allow for any good risk-reward entry points at current levels, there are still stocks that do provide opportunities, and I have one new recommendation in the technology sector.
In today’s column, I will also review some of my recent picks to illustrate how I manage the positions, and why I took some profits on one position yesterday. Also, I will look at some recommendations that are working, one that did not, and one that is a tough call.
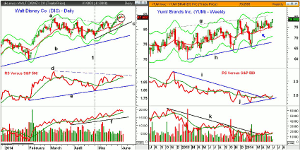
Chart Analysis: Walt Disney Co. (DIS) was one of the Dow stocks I recommended in April’s 4 Dow Stocks Under Accumulation.
- The daily chart shows that the downtrend, line a, was briefly broken in May before it corrected.
- The correction was followed by a strong move to new rally highs.
- In Tuesday’s action (see circle), it looked as though a daily LCD was going to trigger, so I tweeted a recommendation to take some profits. DIS did close below the doji low.
- DIS could drop back into the $82.35-$82.54 area, which corresponds to the 20-day EMA and the monthly pivot.
- The uptrend, line c, and the daily starc- band are in the $81.30-75 area.
- The daily relative performance has not broken out with prices as it has formed lower highs, line d.
- The daily on-balance volume (OBV) did make a new high with prices and is well above daily support at
line f. - A daily close above $84.42 will reassert the uptrend.
Yum! Brands Inc. (YUM) was recommended on March 17, based on the bottoming signals from the weekly technical studies, even though the chart showed a broad trading range. Longs were established (see arrow) on the late-March pullback.
- This trading range, lines g and h, goes back to early 2013 with the upper boundary now at $80.38.
- The monthly projected resistance ($78.45) has already been exceeded with the weekly starc+ band at $81.96.
- The quarterly projected resistance is at $84.76, which would be a level to take some profits.
- The downtrend in the weekly relative performance broke its downtrend, line i, the following week.
- The RS line shows what appears to be a completed bottom formation, line j.
- The weekly OBV broke its downtrend, line k, one week before the buy level was reached.
- Both indicators look positive but need further improvement to signal upward acceleration.
- There is initial support now at $76.35-$76.85.
NEXT PAGE: A Miss and a Tough Call
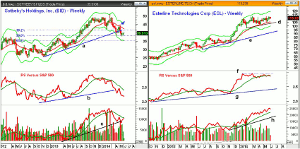
|pagebreak|Sotheby’s Holdings, Inc. (BID) had dropped between the 38.2% and 50% Fibonacci
support levels in early May when it was recommended.
- BID tested its declining 20-week EMA before it reversed and dropped to the recommended buy level.
- The decline took BID below the 50% support level and quickly hit our stop.
- The weekly relative performance had broken its uptrend, line b, before it turned sharply higher.
- The rally in the RS line failed below the WMA and it has subsequently made new lows.
- The weekly OBV had turned up from its support, line c, but it was subsequently violated.
- The daily OBV was lagging when BID was recommended and should have been a reason not to buy.
- The technical studies show no signs currently that the decline is over.
Esterline Technologies Corp. (ESL) was recommended on March 11, based on the strong readings from both the weekly relative performance and OBV analysis.
- The buy level was hit as ESL dropped back to its rising 20-week EMA in early April.
- There is initial support now in the $108 area with the monthly projected pivot support at $106.52.
- The May low at $104.56 is now more important support.
- The weekly chart support, line d, is now in the $105.40 area.
- ESL needs a strong close above the May high of $112.45 to break out of its trending range.
- Such a breakout would provide upside targets in the $119-$122 area with the quarterly projected pivot resistance at $121.51.
- The weekly relative performance has been trading in a tight range as it is just below its highs, line f.
- The weekly OBV is acting stronger than prices as it is well above its rising WMA.
- The daily studies (not shown) are acting weaker.
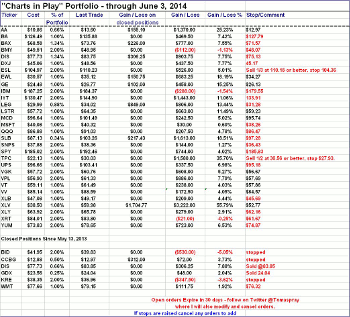
What It Means: Let’s look at each of these stocks individually. For Walt Disney Co. (DIS), the daily low close doji increases the odds of a 2-3% pullback, so I recommended selling 1/3 of the full position at $83.85 or better. DIS traded as high as $84.01 after the recommendation was tweeted.
The current technical outlook for Yum! Brands Inc. (YUM) still looks positive as the long position has a 6.5% gain. I am recommending a stop just below the monthly projected pivot support to lock in a profit. If the daily technical studies turn negative, I will reduce the size of the position.
The weak readings of the daily OBV on Sotheby’s Holdings, Inc. (BID) should have stopped me from recommending it.
Esterline Technologies Corp. (ESL) is a tough call because while the weekly studies are positive, the daily ones are weakening. Longs are showing a 5% profit, and I tweeted before the opening to sell 1/3 at $110.18 or better with a stop on the remaining position just under the entry. If this stop is hit, there will be a slight profit on the entire position. I will raise the stop on a move in ESL above $112.50.
I also have a new recommendation for Altera Corporation (ALTR), which generated an AOT buy signal, Tuesday, (see chart).
How to Profit For Altera Corporation (ALTR), go 50% long at $33.27 and 50% long at $32.75, with a stop at $31.79 (risk of 3.7%).
NEXT PAGE: The Charts in Play Portfolio
|pagebreak|


