Putting his contrarian hat on, MoneyShow's Tom Aspray wonders whether it might make sense now to jump into this sector that has undergone significant corrections since its all-time high in 2011.
It looks as though the earnings season may be much better than the dour forecasts from analysts just a month ago. Though only 21% have reported earnings as of Tuesday, 67% of the companies have beaten estimates. The recent earnings have clearly been supportive for the market.
Economic data is also showing some improvement with the PMI Manufacturing Index and New Home Sales out later today. Big earnings announcements are also slated for release after the close, and though the market internals continue to be strong, the major averages do look over-extended on a short-term basis as the S&P 500 is about 20 points above its 20-day EMA at 1859.
One of the surprises, so far, this year has been the strength of the utilities as the Sector Select SPDR Utilities (XLU) is up over 12% YTD. They were not highly recommended at the end of 2013 and their performance reinforces the merits of having a small exposure to various sectors even if they are not currently in favor.
This is a good argument for the gold mining stocks as even though the Market Vectors Gold Miners ETF (GDX) has been up 12.6% YTD, it has corrected sharply from its highs. Though some of the individual gold miners are acting better than others, the ETFs are the best bet for a small part of your portfolio, but which one?
Chart Analysis: The Market Vectors Gold Miners ETF (GDX) has just 33 stocks with 67% in the top ten holdings including 14% in Barrick Gold (ABX) and 13.4% in Goldcorp, Inc. (GG).
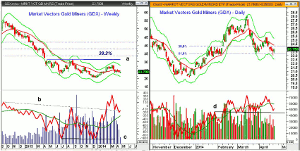
- GDX spiked to a new high at $28.03 on March 14, but then reversed to the downside.
- At Monday's low of $23.04, it was down 17.8% from its high.
- The weekly chart shows that it has been trading below the 20-week EMA at $24.50 for the past five weeks.
- The quarterly pivot is at $24.30 with the early April high at $25.34.
- The weekly on-balance volume (OBV) did form a bullish divergence at the December lows, line c.
- This divergence was confirmed by the strong move through resistance, line b, in the middle of February.
- The OBV is just retesting the breakout level and is still well above its rising WMA.
- On the weekly chart, there is more important resistance at $31.35 with the 38.2% Fibonacci retracement resistance at $33.17.
The daily chart of the Market Vectors Gold Miners ETF (GDX) shows that the minor 61.8% retracement support at $23.21 was slightly violated.
- There is additional support at $22.60 with the daily starc- band at $22.54.
- The daily OBV also broke out to the upside in February as resistance at line d was overcome.
- The OBV is still holding above this level as the volume has been declining over the past few weeks.
- On the early April rally, the daily OBV was stronger than prices, which is a positive sign.
- The monthly pivot for May is tentatively at $24.06 with the daily starc+ band at $25.19.
NEXT PAGE: How Do the Junior Miners Stack Up?
|pagebreak|The Market Vectors Junior Gold Miners (GDXJ) has twice as many stocks as GDX and the top ten holdings make up 37% of the total assets.
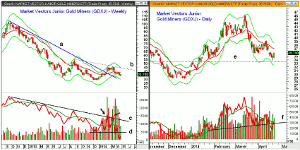
- The weekly chart shows that the downtrend from the late 2012 highs, line a, was broken in February.
- The weekly chart shows lower lows over the past five weeks as GDXJ peaked at $46 in March and had a low of $33.77 on Monday.
- This was a decline of 26.5% from the highs, but it is still up 15.3% YTD.
- The monthly projected pivot support is at $32.62 with the quarterly pivot support at $29.51.
- The weekly OBV slightly broke above its downtrend (line c) twice in 2014, but failed to continue higher.
- The weekly OBV has now broken to new lows as support at line d has been broken.
- There is initial weekly resistance at $37.76, which is the quarterly pivot with further at $39.16.
- The weekly downtrend, line b, is just above $44 along with the weekly starc+ band.
The daily chart of the Market Vectors Junior Gold Miners (GDXJ) shows that it came close to support, line e, at $33.45 on Monday.
- The daily starc- band is at $32.59 with the early 2014 low at $31.05.
- The daily OBV did confirm the March highs as the starc+ band was tested.
- The daily OBV broke its support, line f, on April 15 but has just moved back above its declining WMA.
- The declining 20-day EMA is $36.97 with further resistance at $37.73.
- The close on Tuesday was above the prior two-day highs.
What It Means: Though the Market Vectors Junior Gold Miners (GDXJ) is a better-diversified ETF, its weekly OBV analysis looks significantly weaker than that of the Market Vectors Gold Miners ETF (GDX).
Several gold stocks including AngloGold Ashanti Ltd. (AU) look good technically, but the risk on any one gold stock is significantly higher.
Therefore, GDX is my favored choice but with no clear signs yet of a bottom, I would only take half of the normal position in the Charts in Play portfolio. The Philadelphia Gold & Silver Index (XAU) shows a seasonal tendency to form a short-term low in early May.
How to Profit: For the Market Vectors Gold Miners ETF (GDX), go 25% long at $23.56 and 25% long at $22.88, with a stop at $21.77 (risk of approx. 6.2%).


