The FOMC announcement and Fed Chair Janet Yellen's subsequent press conference are two key events that could rock the markets today, and MoneyShow’s Tom Aspray uses technical analysis to determine if the indicators suggest the market correction is over.
As I mentioned in yesterday’s column, the stock market needed another strong close Tuesday, with good A/D numbers, to turn the “the short term momentum positive.” Well, the market did perform well, with advancing stocks leading the decliners by a 3-1 margin.
The technical studies, like the new high in the NYSE Advance/Decline, do indicate that the market’s correction is over. The Nasdaq Composite and Nasdaq 100 were up well over 1%, while the NYSE Arca Biotech was up 3.29%. The small-caps were also big gainers as the S&P 600 was up 1.32%.
The key stumbling block is the FOMC announcement this afternoon and, of course, Fed Chair Janet Yellen’s press conference. Anything other than the expected $10 billion decrease in bond buying could rock the markets. On Thursday, there is more economic data, including the Philadelphia Fed Survey, Existing Home Sales, Leading Indicators, and, of course, the jobless claims. The leading Indicators, as I discussed yesterday, look very strong and show no signs of a recession.
The week finishes with Quadruple Witching, when the stock index futures, their options, stock options, and stock futures expire, and it is generally accompanied by a fair amount of volatility. Despite the now positive short-term momentum, and bullish signs from the market internals, I would still expect to see a pullback in the new uptrend over the next week.
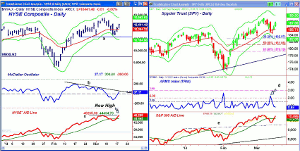
Chart Analysis: The NYSE Composite tested the daily starc- band last Thursday before the recent rally. The decline held above the monthly pivot at 10,209 and support at line a.
- There is next resistance at 10,513, and at 10,548, the most recent high.
- The daily starc+ band is at 10,563 with the weekly now at 10,800.
- The McClellan oscillator closed above the zero line Tuesday and is not far below the resistance at line b.
- The strong market internals this week have pushed the NYSE A/D line to new all-time highs, as the prior high (line c) has been overcome.
- If the A/D line can now accelerate to the upside it would be a bullish indication.
The SPDR Trust (SPY) closed below the 20-day EMA late last week and it now stands at $185.71.
- Last week’s low at $184.44 was well above the 38.2% retracement support at $182.97.
- Based on current data, the 2nd quarter pivot will be in the $183.44 area.
- A close above last Thursday’s high of $187.99 will further support the bullish case with the old high at $188.96.
- The daily starc+ band is at $189.90 with the weekly at $193.49.
- The ARMS Index (TRIN) closed last Thursday at 2.42, which was noted, at the time, as a quite oversold reading.
- It was a further reason not to establish any bearish strategies late last week.
- The ARMs Index has since dropped to 0.94 with the 10-day MA now at 1.18.
- The S&P 500 A/D line has moved sharply above its WMA but is still below its previous high.
- The daily OBV (not shown) is back above its WMA but still below the all-time highs.
NEXT PAGE: 2 Important ETFs to Watch
|pagebreak|The PowerShares QQQ Trust (QQQ) was up 1.2% on Tuesday but volume was slightly lower than average.
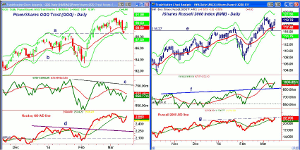
- The low last Friday at $88.63 was a test of the January high, line a.
- The monthly pivot is at $88.23 but will rise to above $90 next week.
- The lower daily starc- band is at $87.59 with the minor 50% Fibonacci retracement support at $87.36.
- The daily OBV has turned up but is still well below its WMA and the downtrend, line c.
- The weekly OBV (not shown) is still active very strong and shows no negative divergences.
- The Nasdaq 100 has moved back above its WMA but is still below its all-time high.
- There is next resistance at $90.93, and then at $91.36, with the daily starc+ band at $91.98.
The iShares Russell 2000 Index (IWM) closed 1.46% higher on Tuesday as it closed above the prior swing high.
- The all-time high is at $120.58 with the daily starc+ band at $121.55.
- The preliminary monthly projected pivot resistance for April is at $123.65.
- The daily chart shows near term support at $116.38 and last week’s low, line e.
- The next quarter’s pivot is tentatively at $115.88.
- The daily on-balance volume (OBV) did make a convincing new high in early March.
- The OBV has turned up sharply from support at line f and has closed back above its WMA.
- The Russell 2000 A/D line has been strong over the past two days and is close to new highs, line g.
What it Means: There has been clear improvement in the technical readings this week, suggesting that the correction may already be over. Any surprises from the Fed’s announcement or press conference could smack down the recent rally, but the technical indicators do suggest that the market is more likely to move higher on the news.
The % of S&P 500 stocks above their 50-day MAs has turned up to 76.5%, after dropping to the mean at 64% last week. Only 59% of the small-cap S&P 500 stocks are above their 50-day MAs so it looks the best for new positions. I would not be surprised to still see a high degree of volatility during the market day, but it will be the close that is important.
How to Profit: For iShares S&P 600 Small-Cap (IJR) go 50% long at $111.94 and 50% at $110.66, with a stop at $107.43 (risk of approx. 3.48%).


