Even though the market shrugged off tensions in Ukraine, with the S&P 500 notching its 40th record close in a year, some investors are still nervous about its continued strength, so MoneyShow’s Tom Aspray examines the charts to see if their concerns are justified.
Tuesday’s market rebound was very strong internally and more than cancels out Monday’s losses. This further supports a bullish market outlook. On Monday’s drop, the declining stocks outweighed the advancing ones by a 2 to 1 margin.
The NYSE Composite’s 1.5% gain on Tuesday was powered by five times more advancing stocks than declining ones. This has caused the NYSE Advance/Decline to accelerate to the upside as it has moved well above the late February highs.
As I noted in yesterday’s analysis of the Dow’s most oversold stocks, the Dow Industrials have been a lagging market average. Despite Tuesday’s gain, the SPDR Dow Industrials (DIA) is still down 1.1% for the year, while the iShares DJ Transportation Average (IYT) is up 1.5%.
Some investors are also nervous about the market since the Dow Industrial Average has not yet made a new high in 2014. Is their concern justified and which stocks look the strongest?
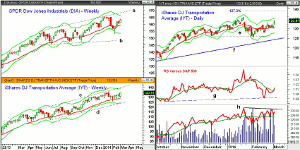
Chart Analysis: The weekly chart of the SPDR Dow Industrials (DIA) shows that it made a high on December 31 of $164.93. It was up 1.3% on Tuesday but is still 0.7% below these highs.
- The weekly starc+ band is at $166.20 with the trend line resistance at $168.59, line a.
- The rising 20-week EMA at $159.30 is now the first key level of support.
- In contrast, the iShares DJ Transportation Average (IYT) made a new high of $135.93 on January 23.
- This was 2.8% above the December 31 high of $132.14.
- For IYT, the weekly starc+ band is at $138.01 with the upper boundary of the trading channel (line c) just a bit higher.
- The failure of the Industrials to make a new high in January is not a Dow Theory sell signal.
- The Dow Industrials have just not confirmed the new highs in the Transports.
- This is likely to happen in the coming months as many will remember that the Transports failed to make new highs with the Industrials for much of 2012.
- A break below the support at $123.90-$125 for IYT would now be a sign of weakness with more important support for both averages at last summer’s lows.
The daily chart of iShares DJ Transportation Average (IYT) shows it gapped higher, Tuesday, and then closed above the prior high.
- Prices had held the 20-day EMA and the monthly pivot at $130.07 on Monday’s decline.
- The quarterly pivot of $126.09 was tested in early February but held on a weekly closing basis.
- The daily relative performance did make new highs with prices in January and is now back above its WMA.
- The weekly RS line (not shown) also confirmed the highs but is still below its WMA.
- The daily OBV tested its WMA several times last month and a breakout above the resistance at line h would be bullish.
- The weekly OBV will make a significant new high this week as it is leading prices higher.
- The 127.2% Fibonacci retracement resistance calculated from the recent decline has upside targets at $139.
NEXT PAGE: 2 Transportation Stocks to Buy
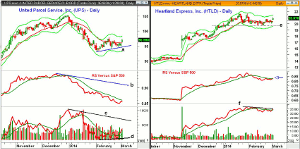
|pagebreak|United Parcel Service, Inc. (UPS) peaked at $105.37 on December 31 and eventually hit a low of $92.53 on February 4.
- This was a decline of just over 12% as the quarterly projected pivot support at $92.88 was reached.
- UPS dropped below its monthly pivot at $95.15 on Monday then gapped higher Tuesday.
- There is next resistance at $97.22 with the quarterly pivot at $98.75.
- The weekly starc+ band is at $101.75, which corresponds to stronger chart resistance.
- The daily relative performance formed a slight negative divergence at the high, line b, and is still below its WMA.
- The daily OBV appears to have completed it short-term bottom formation, line d, as it has moved well above its February highs.
- There is stronger OBV resistance at line c and the weekly OBV (not shown) did confirm the highs.
- There is minor support now in the $96-$96.50 area with the 20-day EMA at 95.85.
Heartland Express, Inc. (HTLD) is a $1.83 billion dollar short-to-medium-haul trucking company.
- The stock has held in a narrow range since late December and is just 3.47% below its recent high of $21.62.
- The February low, line e, corresponded to the monthly projected pivot support.
- For March, the projected monthly support is at $19.66 with further support at $19.
- The relative performance has just moved back above its WMA and did confirm the recent highs.
- The weekly RS line has turned up from its rising WMA.
- The daily OBV has also moved back above its WMA and is just below the resistance at line f.
- The weekly OBV (not shown) will close at a new high this week.
- Once above the old highs, the quarterly projected pivot resistance is at $23.71.
What It Means: I still think that the transportation stocks will benefit from the stronger economy I am expecting in 2014. Two of the stocks recommended in January’s 3 Transport Picks Ready to Breakout hit the buy levels and GATX Corp. (GMT) is up over 26%.
Given the market’s strength, one should still not chase any stocks as a slight setback will be needed to hit the recommended buy levels. There are also some industrial stocks with very positive charts that I will be featuring soon.
How to Profit: For United Parcel Service, Inc. (UPS), go 50% long at $96.66 and 50% long at $96.06, with a stop at $93.29 (risk of approx. 3.2%).
For Heartland Express, Inc. (HTLD), go 50% long at $20.72 and 50% long at $20.41, with a stop at $19.43 (risk of approx. 5.5%).
Portfolio Update: Should be long iShares DJ Transportation Average (IYT) at $130.47 with a stop at $125.43.


