With the Dow Industrials lagging the S&P 500, so far this year, MoneyShow’s Tom Aspray analyzes some of the most oversold Dow stocks to identify some new opportunities among these high-yield, large-cap stocks.
Across the board losses in the US stock markets were not as severe as those in the Eurozone and the market internals were less negative than the price action. World markets are rebounding, early Tuesday, as the S&P futures are trading above last Friday’s highs.
Russian President Putin held an early morning press conference and while he made some ambiguous comments, tensions have clearly lessened. A strong close, Tuesday, will support the view that Monday’s drop was a buying opportunity.
With Monday’s loss, the Spyder Trust (SPY) is just barely positive for the year while the SPDR Dow Industrial Average (DIA) is still down over 2%. Given the weak performance of the Dow Industrials, it was surprising that more Dow stocks were not closer to their monthly starc- bands. As a quick reminder, this scan looks at where the 30 stocks that make up the Dow Industrials closed February in relation to their starc bands.
This has been a regular monthly feature for a few years and has helped to identify quite a few good profit opportunities. If a stock closes near its upper starc band (starc+), it is considered to be a high-risk buy and overbought. Conversely, closeness to the lower starc band (starc-) indicates that a stock is a high-risk sell or oversold.
Topping the list this month is AT&T Co. (T), which is just 7% above its monthly starc- band as is the SPDR Dow Industrials (DIA). This month, I have also added a column to show the relationship of the stock price to its 50-day moving average. For example, AT&T Co. (T) is 4.6% below its 50-day MA while McDonald’s (MCD) is 0.6% above its 50-day MA but just 9% above its monthly starc- band.
The review of the monthly charts and technical studies for each of the stocks often reveals some stocks that appear to be completing their corrections. These Dow stocks, I think, are the best examples of Dow stocks that appear to be bottoming or are still vulnerable.
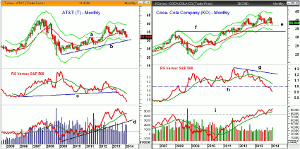
Chart Analysis: Though AT&T Co. (T) is the most oversold Dow stock as it closed near the month’s lows and has tested the highs from May 2011, line a. It has a current yield of 5.68%.
- The break below the August 2013 and November 2012 lows does indicate that a new downtrend (lower lows) is in place.
- The monthly uptrend that connects the 2009 and 2010 lows, line b, is in the $29.20 area.
- The monthly relative performance has been below its WMA since November 2012.
- The RS line violated long-term support, line c, last May and has since dropped sharply.
- The monthly OBV dropped below its WMA at the end of December and is now close to long-term support at line d.
- The weekly OBV (not shown) is also negative as it has dropped well below the October lows.
- There is first resistance now in the $32.50-$33.40 area and T has been below its quarterly pivot at $34.56 since January 10.
The Coca-Cola Company (KO) recently raised it dividend by 9% for the 52nd consecutive quarterly dividend increase. It now yields 2.94% but still the stock has been under pressure. It is down 7.7%, so far in 2014, as some have questioned the company’s strategy.
- The monthly chart shows that important support in the $36.57-$36.89 area was tested last month.
- The monthly pivot at $38.04 is now being tested with the monthly projected pivot resistance at $39.16.
- The quarterly pivot at $39.76 now represents more important resistance.
- The relative performance did form a negative divergence, line g, at the 2012 highs.
- The RS line has been below its WMA since August 2012 and violated long-term support, line h, in late 2013.
- The monthly on-balance volume (OBV), on the other hand, looks very strong as it dropped back to support last September.
- The OBV closed at new highs in February and the weekly OBV (not shown) is close to moving back above its WMA.
NEXT PAGE: 2 More Oversold Dow Stocks to Watch
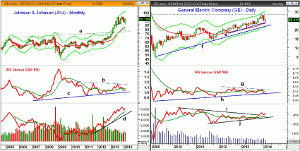
|pagebreak|Johnson & Johnson (JNJ) had a low last month of $85.47, which was fairly close to February’s projected pivot support at $85.06. It has a current yield of 2.88%.
- The stock is down 1.86% over the past three months versus a 3.47% gain in the Spyder Trust (SPY).
- Several large investors, including Warren Buffett, have reduced their holdings in JNJ.
- The trading range since last August appears to be a continuation pattern or a pause in the uptrend.
- There is major resistance now at $94.59 to $95.30.
- JNJ has been holding above the quarterly and monthly pivot at $90.18 to $90.08.
- The monthly relative performance has been below its WMA for the past two months.
- The major uptrend in the relative performance, line c, is important support.
- The weekly RS line (not shown) is below its declining WMA.
- The OBV continues to act very strong as it turned higher last week.
- The OBV is well above its rising WMA and support at line d.
General Electric (GE) peaked at $27.85 at the end of 2013 and is down 9.6%, so far, in 2014. The stock currently yields 3.26%. It was recommended in late January.
- The stock is above the February low of $24.11 as it came close to the S2 quarterly support at $24.40.
- The longer-term uptrend on the monthly chart, line f, is now at $21.96.
- The monthly projected pivot resistance is at $26.15 with the quarterly pivot at $28.25.
- The relative performance has dropped slightly below the long-term support at line h, which makes this month’s close more important.
- The RS line needs to move above the resistance at line g to signal it is a market leader.
- The monthly OBV broke through major resistance, line i, at the end of November.
- The weekly OBV (not shown) is above its WMA and close to the December highs.
What It Means: The technical action in AT&T Co. (T) suggests that it could drop back to long-term support in the $30 area before it bottoms out.
The closeness of the Coca-Cola Company (KO) to year-long monthly support and the strong OBV makes it attractive at slightly lower levels. This outweighs the weak relative performance analysis.
The support is also well defined in Johnson & Johnson (JNJ) and the volume pattern looks very strong. The daily relative performance could turn positive in the next few weeks.
As for General Electric (GE), the strong monthly OBV reading favors using a stop under the February lows on existing positions.
How to Profit: For Coca-Cola Company (KO), go 50% long at $37.62 and 50% long at $36.94, with a stop at $35.63 (risk of approx. 4.4%).
For Johnson & Johnson (JNJ), go 50% long at $90.14 and 50% long at $87.44, with a stop at $84.55 (risk of approx. 4.7%).
Portfolio Update: For General Electric (GE), long from $24.48, use a wider stop at $23.67.


