Although materials was one of the worst-performing sectors of 2013, it appears to be trying to stage an upside breakout as MoneyShow’s Tom Aspray examines two potential buy candidates in this group.
Once again, the S&P 500 pushed to the upside in early trading as it was up over 7 points and trading well over 1850. The rally ran out of gas around lunch time and the S&P 500 closed flat for the day. The mid-cap S&P 400 was up 0.49% and the small-cap S&P 600 gained 0.87%.
The biggest gainer was the Dow Jones US Select Home Construction Index as it was up 2.82% on the back of the stronger-than-expected New Home Sales, which surged 9.7% in January despite the bad weather. Many of the retailers were also strong as they also seem to be immune to the rough winter weather.
The market debate is still whether the key S&P 500 is forming a double top or is just consolidating before a new strong rally phase. Even though the S&P 500 pushed to new intra-day highs, Monday, it has failed to produce a significant close above the old highs.
The Eurozone markets and the US stock index futures are all lower in early trading ahead of the durable goods report this morning. A lower daily close could set the stage for a further pullback over the short term. The continued strength of the market internals and the NYSE Advance/Decline both favor an eventual upside resolution.
The materials sector is being watched by many as it has also been trying to break out to the upside in the past week. The technical action of the Select Sector SPDR Materials (XLB) does favor an upside breakout and these two material stocks appear to be completing their bottom formations.
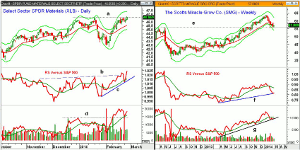
Chart Analysis: The daily chart of the Select Sector SPDR Materials (XLB) shows that the January high at $46.56, line a, was slightly exceeded on Wednesday.
- The daily starc+ band is at $47.33 with the weekly at $47.61.
- The daily relative performance broke through resistance at line b last week.
- After a sharp pullback to its rising WMA, the RS line has again surged to the upside.
- The daily OBV also overcame its two-month resistance, line d, in early February.
- The OBV retested the breakout level and its rising WMA on Monday.
- The weekly OBV (not shown) is well above the highs from last fall and is acting stronger that prices.
- There is initial support now at $45.50-$46 with the monthly pivot for March at $45.34.
- The quarterly pivot is at $44.42 and represents much stronger support.
The Scotts Miracle-Gro Company (SMG) has a market cap of $3.54 billion and a yield of 3.10%. SMG peaked at $62.90 in January and dropped as low as $54.90 in early February.
- This was a decline of 12.7% as the weekly starc- band was exceeded.
- The ranges have narrowed over the past few weeks as the monthly projected pivot support at $55.64 has held.
- A doji was formed on Tuesday with a low of $55.49 and a HCD buy signal was triggered with Wednesday’s close.
- The weekly starc- band is now at $53.84 with the October low at $52.76.
- The weekly relative performance has dropped sharply since early January and is now testing its uptrend, line f.
- The weekly OBV is testing the support that goes back to early 2013, line g.
- A move back above its WMA would be positive and the daily OBV (not shown) is still below its WMA.
- There is initial resistance at $56.28, which was last week’s high with the quarterly pivot at $58.86.
NEXT PAGE: 1 Materials Stock to Watch
|pagebreak|The Chemical & Mining Co. of Chile Inc. (SQM) is a $7.56 billion chemical company that produces and distributes plant nutrients.
- The stock was up almost 8% in Wednesday’s trading with four times the average volume.
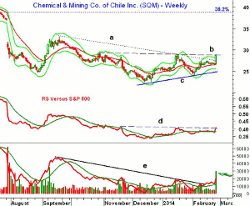
- The close was at the daily starc+ band and the chart resistance at line b. The downtrend from the September highs, line a, has been broken.
- There is quarterly projected pivot resistance at $29.78 with the weekly starc+ band at $30.59. The daily relative performance is just breaking its downtrend, line d.
- The major 38.2% Fibonacci resistance is just below $39 and is calculated from the 2012 high of $65.31.
- The weekly RS analysis (not shown) also appears to be bottoming.
- The daily OBV broke through its downtrend, line e, two weeks ago and has turned up from its WMA.
- The weekly OBV (not shown) also appears to have bottomed.
- There is first support now at $27.40 with the quarterly pivot at $26.14.
- The early February low was $24.24.
What It Means: The fact that the daily and weekly technical studies have already broken out to the upside does favor an eventual upside breakout in the Select Sector SPDR Materials (XLB). Unfortunately, our buy levels from early February were not hit.
Scotts Miracle-Gro Company (SMG) needs further upside momentum to confirm a bottom while the risk in the Chemical & Mining Co. of Chile Inc. (SQM) is much higher.
How to Profit: For Select Sector SPDR Materials (XLB), go 50% at $45.88 and 50% at $44.94, with a stop at $43.57 (risk of approx. 4.1%).
For the Scotts Miracle-Gro Company (SMG), go 50% at $56.66 or better and 50% at $56.18, with a stop at $43.57 (risk of approx. 3.3%).
For the Chemical & Mining Co. of Chile Inc. (SQM), go 50% at $27.54 or better and 50% at $26.76, with a stop at $25.79 (risk of approx. 5.0%).


