MoneyShow’s Tom Aspray takes a technical look at four market-lagging sectors, which can help investors avoid them and concentrate their stock selection efforts in market-leading sectors instead.
The early round of selling, Thursday, suggested that the market leading PowerShares QQQ Trust (QQQ) could trigger a daily low close doji sell signal, which would have been consistent with a short-term pullback. However, by the second hour of trading, it was back in positive territory and closed very strong at new bull market highs.
The market internals were positive again with three times as many advancing stocks as there were decliners on the NYSE. The NYSE Advance/Decline closed above the January 22 high and is leading the NYSE Composite higher. The Nasdaq 100 A/D line is rising even more sharply and is also acting stronger than prices.
While some market sectors and industry groups, like the heavy construction stocks discussed yesterday, are acting much stronger than the S&P 500, others are not. The relative performance analysis should play an important role in your stock selection and these four industry groups are currently acting weaker than the S&P 500.
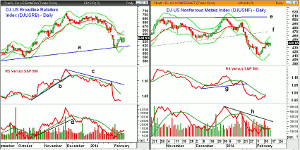
Chart Analysis: The Retail Sales data declined for the second month in a row in January and was weaker than most expected. This is reflected in the weak action of the DJ US Broadline Retailers Index (DJUSRB).
- The Index hit a high in early December as it tested the daily starc+ band. It is down over 9% from these highs.
- In comparison, the Spyder Trust (SPY) is up 1.3% and a few stocks like Macy’s (M) have been bucking the weakness in the Index.
- The chart shows that long-term support, line a, was tested in early February as the daily starc- band was also reached.
- The daily relative performance dropped below its uptrend, line b, and its WMA in early December.
- The RS line shows a series of lower highs consistent with a market lagging group.
- The OBV also broke its support, line d, and is back to the August lows as it is weaker than prices.
- The rebound has been weak, so far, as the Index has not even reached the 20-day EMA at 647.
The DJ US Nonferrous Metals Index (DJUSNF) formed a double doji high at the end of the year (line e) and is currently down 12.7% from these highs.
- The weekly chart shows that it completed a double top formation in January.
- The support at line f was violated on January 22 and the Index dropped below its daily starc- band for the next three days.
- As the DJUSNF was testing its highs, the relative performance was acting much weaker as it was forming lower highs.
- The RS line broke its support, line g, three days before prices broke support.
- The daily OBV is now in a well-established downtrend, line h.
- The Index is now testing its 20-day EMA where the rally could fail.
- There is further resistance, line f, in the 470 area.
- The weekly support in the 400-405 area was tested last week.
NEXT PAGE: 2 Other Weak Sectors
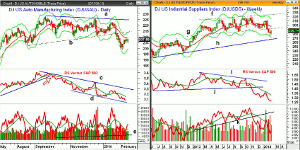
|pagebreak|The DJ US Automobile Index (DJUSAU) appears to have completed a daily top formation, lines a and b, as it broke support on January 24.
- As of Thursday’s close, the Index is still down 8.1% from the December high at 225.90.
- The Index contains star performers like Tesla Motors Inc. (TSLA), which is up over 47% in the past three months, along with Ford Motor Inc. (F) that has lost 11.6%.
- The daily starc- band was tested last week indicating that the Index was at a high-risk sell level.
- There is next major support from the summer of 2013 in the 177-180 area.
- The relative performance broke its uptrend (see arrow) last September and now shows a well-established downtrend, line c.
- The RS line has also formed lower lows, line d, which is a sign of weakness.
- The OBV has dropped below the support going back to last October, line e.
- The weekly OBV (not shown) is back above its WMA and does look stronger.
- There is strong resistance now in the 212-215 area.
The DJ US Industrial Suppliers Index (DJUSDS) peaked at 321.87 on November 1 and then violated support at line h, three weeks ago. Two of the best-known stocks in the Index are W.W Grainger (GWW) and Fastenal Co. (FAST).
- This completed the weekly trading range, lines f and g, which had downside targets in the 275-280 area.
- This target has already been met, and despite the rebound, the Index is still down 10.9% from its highs.
- The longer-term support, line h, is in the 265-270 area.
- As the Index was making higher highs, the relative performance was making lower highs, line i.
- The break of the RS line support (line j) came in mid-November and did warn of the recent drop.
- The weekly on-balance volume (OBV) also dropped below support, line k, in November.
- The OBV rebounded back above its declining WMA before again dropping to new lows.
- The weekly starc- band was tested last week and there is first strong resistance now at 290 with the declining 20-week EMA at 297.
What It Means: As evidenced by the impressive performance of Tesla Motors Inc. (TSLA), some stocks can still do very well even if its industry group is acting weaker than the overall market.
However, in my experience, you are generally better off sticking with stocks that are in market-leading sectors or industry groups like the 2 Off-the-Radar Picks I discussed yesterday.
How to Profit: No new recommendation.


