The high-flying biotech sector has recently pulled back after turning in eye-popping returns in 2013, and MoneyShow’s Tom Aspray investigates whether the next spate of earnings announcements can be the catalyst for it to make new highs in 2014.
Stocks started off the week on a quiet note, which after last week’s volatility is a welcome change. I do not expect the calm to last too long as the strength late last week seems to have put the bulls back in charge.
The market focus is on the testimony of Janet Yellen and some critics of quantitative easing will also be testifying. This is somewhat unusual, but still, I would be surprised to see any dramatic market-making developments from the testimony.
The market internals, Monday, were stronger than prices and after the gold miners, the biotech sector was not far behind as the 2.0% gain in the NYSE Arca Biotech was considerably better than the S&P 500’s small 0.16% gain.
The recent pullback in the biotechnology sector has been quite shallow and the charts suggest that the correction may already be over. Last week, 14 of the stocks in the Nasdaq Biotechnology Index (IBB) reported their earnings and three other key components are set to release their earnings in the next two days.
Will this trigger an upside breakout of the sector’s recent trading range?
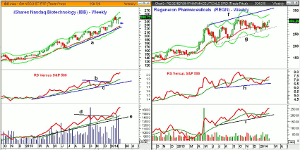
Chart Analysis: The candle chart of the Nasdaq Biotechnology Index (IBB) shows that there was good demand for the ETF in the $232-$234 area (see arrow).
- The rising 20-week EMA is at $226.92 along with the weekly uptrend, line a.
- Once above the prior high at $254.11, the weekly starc+ band is at $262.03.
- The monthly projected pivot resistance is at $272.59.
- The relative performance moved above its WMA last November before breaking through resistance, line b, at the start of the year.
- The RS line shows a long-term uptrend and a strongly rising WMA.
- The OBV dropped back to test its WMA in early December and then staged an upside breakout (line d) in January.
- The OBV is acting much stronger than prices but the daily OBV (not shown) is still below its WMA.
- The rising 20-day EMA is at $241.67 and further support is at $240.
- The lower daily starc- band is now in the $229 area.
Regeneron Pharmaceuticals (REGN) reports earnings today before the opening and there seems to be some debate as to whether their results will meet expectations.
- There is initial support at $284.14 and the quarterly pivot with the 20-week EMA at $283.31.
- There is weekly support going back to November, line g, at $270.90.
- The weekly starc- band is now in the $240 area.
- The relative performance held the support at line h and is holding above its WMA.
- The daily RS analysis (not shown) does appear to have completed its correction in early January.
- The weekly on-balance volume (OBV) made new highs last week, which is a bullish sign.
- The daily OBV (not shown) is positive and volume was strong on Tuesday.
- There is minor support now in the $288-$291 area.
NEXT PAGE: 1 Stock & 1 Biotech ETF to Watch
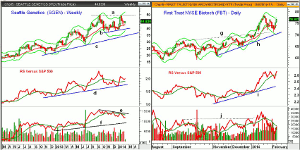
|pagebreak|Seattle Genetics (SGEN) will report its earnings after the close today as the stock has been trying to hold above the 20-day EMA at $42.25.
- The chart has further support in the $39 area, line b, with the weekly starc- band at $36.84.
- There is initial resistance now in the $46-$47 area.
- A weekly close above the January high at $46.95 would project a move to the $60-$62 area.
- The relative performance held the support at line d and is now above its WMA.
- The weekly OBV shows a short-term pattern of lower highs, line e, and is below its WMA.
- The OBV has longer-term support at line f.
- SGEN did hold above its quarterly pivot at $41.05 on the recent decline as the low was $41.51.
- There is additional support now at $38.57, which is the quarterly S1 level.
First Trust NYSE Biotech (FBT) has some smaller names than IBB with just 20 stocks in its portfolio as compared to 118 in IBB.
- The lower starc- band and the breakout level on the daily chart, line g, were tested with last week’s low of $71.17.
- The completion of the short-term flag formation has upside targets in the $83-$85 area.
- The longer-term uptrend, line h, is in the $70 area along with the weekly starc- band.
- The daily relative performance broke out of its trading range in early January.
- The RS line has turned sharply higher indicating that FBT is still leading the market higher.
- The daily OBV broke through resistance at line j last month.
- The OBV has since reversed to the downside and it is still below its WMA.
- The weekly OBV (not shown) is still holding above its rising WMA.
What It Means: The biotechnology sector is still one of my favorite sectors in 2014 as it has been for the past two years. Since it is not completely clear yet that the market’s correction is over, I would only look to buy on a drop back towards the recent lows.
The distance from good support keeps me from recommending the Nasdaq Biotechnology Index (IBB). I do like the First Trust NYSE Biotech (FBT) on a pullback towards last week’s lows.
Regeneron Pharmaceuticals (REGN) looks quite strong but investors should look for a Tweeted recommendation after the market has a chance to digest its earnings. I like the continuation pattern in Seattle Genetics (SGEN) but the weekly OBV keeps me cautious. Incyte Corporation (INCY), another leading biotechnology company, reports its earnings on Wednesday.
How to Profit: For First Trust NYSE Biotech (FBT), go 50% long at $73.12 and 50% long at $71.48, with a stop at $67.77 (risk of approx. 6.2%).
Editor’s Note: If you’d like to learn more about technical analysis, attend Tom Aspray’s workshop at The Trader’s Expo New York, February 16-18, 2014. You can sign up here, it’s free.


