The heavy level of selling last week has pushed many of the S&P 500 stocks to oversold levels and MoneyShow's Tom Aspray thinks that some of them can still go even lower.
Investors continued to react to last week's sharp stock market decline with all, except the Dow Utilities, closing lower. The decline was the largest in the small-caps, as the Russell 2000 lost 1.43%, followed by a 0.92% decline in the Nasdaq 100.
There were some signs that prices were stabilizing, even though the market internals were 3-1 negative, which has pushed the McClellan oscillator down to -167. The heavy selling in Asia abated overnight, and the euro markets are higher, with Spain up close to 1.5% in early trading. The futures are also higher, and a positive close should set the stage for the rebound I have been expecting.
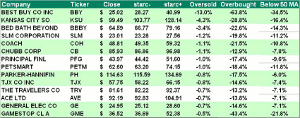
In one of my weekend scans, I noticed that 14 of the S&P 500 stocks closed last week under their weekly starc- bands. This is fairly uncommon and means that they are in a high risk selling zone, but does not mean that they cannot still go lower.
The odds of some sideways trading, or a bounce, is likely, as several of the stocks on the table have been hit by gap lower openings, or "air pockets," over the past few weeks. Leading the list is Best Buy Co. Inc. (BBY), which closed last Friday 13% below its starc- band. The table also includes the % difference between Friday's close and its 50-day MA. For example, BBY is 34.5% below its 50-day MA at $38.23.
Many will remember that Best Buy Co. Inc. (BBY) was one of 2013's big surprises, and was written up extensively this fall for its apparent turnaround. Even after it's down gap on November 19, in reaction to its disappointing earnings, some were still caught up in the hype and were recommending it. The stock has dropped 36.5% since the November 19 close.
In reviewing the charts of these 14 stocks, I only found one that is starting to look interesting to me once the daily technical studies have bottomed out.
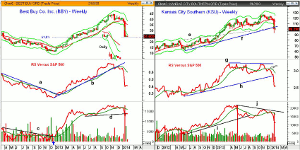
Chart Analysis: The weekly chart of Best Buy Co. Inc. (BBY) shows that it has dropped down to test the major 61.8% Fibonacci retracement support from the December 2012 low.
- The insert of the daily chart shows that BBY gapped sharply lower on January 16, in reaction to
weak holiday sales.
- BBY closed below the daily starc- band for several
days after that weak opening.
- The next monthly support from April 2013 is at $21.24.
- The relative performance broke its long-term
downtrend, line a, in early 2013, signaling that it was becoming a market
leader.
- The uptrend in the RS line was violated in November
and it then rebounded back to its flattening WMA, before dropping sharply.
- The weekly OBV bottomed in December of 2012, as it
moved above its WMA and the downtrend, line c.
- There was a weekly volume spike in November and, by
the week before Christmas, it had dropped below its WMA.
- There is first resistance at $28.20 and the 20-day EMA
is at $32.11.
Kansas City Southern (KSU) reported an earnings and revenue miss last Friday, and dropped 15% in Friday's trading. It had closed below its quarterly pivot at $119.19 on January 10.
- KSU closed below the uptrend from the 2012 lows, line
f, as the stock spiked as low as $92.50 in panic or stop loss selling.
- This was just below the major 50% retracement support
from the 2012 low at $93.14.
- The relative performance did not make a new high with
prices at the end of 2013 and then dropped below its WMA on December 6.
- The RS line rebounded back to its WMA as part of the
topping process, (see arrow).
- The longer term support in the RS, line h, has now
been broken.
- The on-balance volume (OBV) broke its uptrend, line i,
last summer, after the heavy volume drop in May.
- The OBV made much lower highs in November, line j,
suggesting that the rally was weak.
- The volume was heavy last week and the OBV is now well
below its WMA.
- The weekly pivot is now at $103.60 with a major gap in
the $116.50 to $104 area.
NEXT PAGE: Two More Stock Market Victims
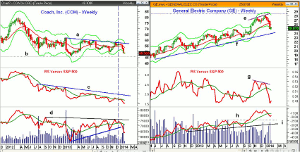
|pagebreak|Another casualty in the retail sector was Coach, Inc. (COH), which is down almost 14% so far in 2014. It closed 1.1% below its starc- band and is 10.8% below its 50-day MA.
- The stock has one of the weakest looking charts, as it
has formed lower highs, line a, since December 2012. It was up just 3.48% in
2013.
- COH rallied up to its starc+ band at the end of
November, but then moved sideways for six weeks, as volume declined, (line 1).
- It is still trying to hold above the October lows of
$47.88, with further support at $45.50, line b.
- The relative performance has formed lower lows and
lower highs (line c) since the early part of 2012.
- The weekly OBV reached resistance from 2012 in
November, before stalling.
- The daily OBV (not shown) showed a clear topping formation
in early January.
- There is minor resistance now at the $49.60-$50 range,
with February's monthly pivot at $51.11.
General Electric Company (GE) peaked at $28.09 on December 31, and has only had two positive daily closes in 2014. It has a current yield of 3.15%.
- The stock is down 10.5% so far in 2014, as the 20-week
EMA, at $25.96, was decisively violated last week.
- The quarterly S2 support is at $24.40 with the longer term
uptrend, line f, now at 23.94.
- The October 2013 low was $23.50 with the June low at
$22.76.
- The relative performance did not confirm the late 2013
highs as it formed a negative divergence, line g.
- The RS line is already back to the 2013 lows.
- The weekly OBV did confirm the highs and staged an
impressive breakout through resistance, at line h, last fall.
- The OBV is still holding well above the breakout level
and the long-term uptrend, line i.
- There is initial resistance now at $25.60, with the
quarterly pivot at $26.54.
What it Means: Of these four stocks, General Electric Company (GE), looks the best technically, from both the weekly and monthly charts. The tightest stop would be under the $23.50 low, and the daily studies are still negative and show no signs yet that the decline is over.
Given my bullish outlook on the economy, I also think the railroads will have a good year, but the technical damage to KSU will take some time to repair.
A rebound this week will need to be watched closely, but the more negative articles we see about the stocks market will reduce the too high bullish sentiment and may shorten the length of the correction.
How to Profit: For General Electric Company (GE), go 50% long at $24.48, and 50% at $23.36, with a stop at $22.66 (risk of approx. 5.3%).
Editor’s Note: If you’d like to learn more about technical analysis, attend Tom Aspray’s workshop at The Trader’s Expo New York, February 16-18, 2014. You can sign up here, it's free.


