After turning in its first losing year in 2013 in a long time, many have been wondering where gold’s bottom might be as MoneyShow’s Tom Aspray takes a technical look to determine whether or not now is a good time to buy.
The series of earning’s hits and misses has captured the focus of investors as has the continuing divergence between the Dow Industrials and the Nasdaq 100. The SPDR Dow Jones Industrials (DIA) is down 0.3%, so far this week, while the PowerShares QQQ Trust (QQQ) is up just over 1%.
These divergences are also evident in the market internals as while the NYSE Advance/Decline and Nasdaq Advance/Decline lines have made further new highs, the Dow A/D line has not. The volume analysis of the leading indices also looks strong and together they favor an eventual upside resolution of the trading ranges.
Following the miserable 2013 performance of gold and the gold miners, their recent gains have gotten a bit more attention, but most investors have been burnt by gold’s drop in the last quarter of 2013 as forecasted in early November’s Gold: Bull Trap Ready to Close as the volume analysis led prices lower.
The recent rally in the precious metals and miners appears to be losing upside momentum but the technical action has improved over the past two months. The analysis now suggests that the next correction should provide a good opportunity.
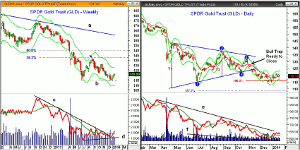
Chart Analysis: The weekly chart of the SPDR Gold Trust (GLD) shows that the rally from the summer 2013 lows failed at the 38.2% Fibonacci retracement resistance level of $137.55 (see arrow).
- The weekly chart now shows a potential double-bottom formation, line b, as GLD made a marginal new low at $114.46 at the end of the year.
- This was just a bit lower than the June lows and a close above the 38.2% resistance is now needed to complete the double bottom.
- The volume analysis has improved over the past few weeks as the downtrend in the on-balance volume (OBV), line c, has been broken.
- The OBV has also moved above its WMA after forming a bullish divergence, line d, at the recent lows.
- The OBV needs to move above the August-October highs to confirm this divergence.
- The next support at $117.63 and the monthly pivot.
The daily chart of the SPDR Gold Trust (GLD) has been updated from last November (see chart) when the equality target was at$115.74.
- This assumed that the decline from point 4 would be equal to the decline from point 2 to point 3.
- The 127.2% Fibonacci target was at $108.65.
- The rally moved above the quarterly pivot at $120.67 but has failed below the early December high of $122.32.
- The 20-day EMA is now being tested with swing low along with the daily starc- band in the $117 area.
- The daily OBV has just reached its long-term downtrend, line e, but is still holding above its WMA
- The daily OBV did make new lows with prices, line f, in December.
NEXT PAGE: An ETF to Watch
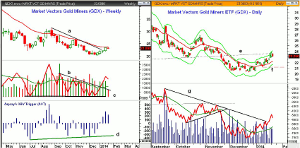
|pagebreak|The weekly chart of the Market Vectors Gold Trust (GDX) shows that it reached the 20-week EMA after breaking its downtrend, line a, over two weeks ago.
- The top ten holdings of GDX make up 67% of the ETF with Goldcorp, Inc. (GG) the largest holding of almost 14%.
- The next strong resistance is at $24-$25 with the weekly starc+ band at $26.35.
- The close last Friday was above the quarterly pivot at $22.01 with the monthly pivot and further support at $21.19.
- The OBV moved through its downtrend (line b) and it’s WMA during the first week of January.
- The OBV looks ready to turn lower this week and did not form significant new lows with prices, line c.
- The Aspray’s OBV Trigger (AOT) did form a significant positive divergence at the lows, line d, and is now well above the zero line .
- A pullback in the AOT to the zero line could trigger a buy signal.
The daily chart shows that the Market Vectors Gold Trust (GDX) has rebounded back to former support, now resistance at the October lows, line d.
- The 20-day EMA is at $22.22 with the daily starc+ band at $21.60.
- There are likely many stops under the January 9 low of $21.26.
- A pullback in GDX could violate this level with more important support now at $20.50 area.
- The daily OBV is much stronger on GDX then it is on GLD as it has convincingly broken its downtrend, line g.
- The OBV moved above its WMA at the end of 2013 and is now well above its rising WMA.
- Typically it would take three-five days for the OBV to drop back to its WMA.
What It Means: At the end of November, I still thought it was too early to buy either gold or the miners as I felt another new low was needed before a bottom could form. The technical outlook has now clearly improved so the next correction in both the SPDR Gold Trust (GLD) and Market Vectors Gold Trust (GDX) will need to be watched closely.
Gold is up sharply in early trading and on a strong close this week we will probably need to wait for a correction to come from higher levels. Once we see a weekly close below the prior week’s lows it will indicate that a correction is underway. The miners are preferred based on the better looking weekly chart and the stronger daily OBV.
How to Profit: For the Market Vectors Gold Trust (GDX), go 50% long at $22.28 and 50% long at $21.52, with a stop at $20.43 (risk of approx. 6.7%).


