Bottom fishing is often an appealing strategy to some but there needs to be technical evidence to support any decision, says MoneyShow’s Tom Aspray, as he examines the charts of three stocks that severely underperformed the overall market in 2013.
The slight bout of profit-taking ended Tuesday as the major averages all recorded nice gains led by the Nasdaq and the small caps. The gains were not enough to reverse the weekly technical deterioration in the S&P 400 and S&P 600 discussed in yesterday’s column but the short-term momentum has improved.
The failure of the overall market to generate any sell signals does not warrant testing the short side, but from a stock picking standpoint, one has to be very selective. There are a number of stocks with charts that are bottoming but there are also stocks with weak charts that should be avoided. European shares and the futures are lower in reaction to the release of data on the Eurozone unemployment.
Some analysts and investors are now looking to those stocks that severely underperformed in 2013, often called market dogs. This can be a viable strategy as several of the stocks least favored by analysts at the start of 2013 were some of the year’s best performers. The average performance of the five least-favored stocks was 74% better than the Spyder Trust (SPY).
All three of these stocks did significantly worse than the overall market in 2013 even though many analysts had expected them to keep pace with the market or outperform it in 2013. Now, these stocks are again being discussed as potential buy candidates but a look at the weekly technical studies should change their minds.
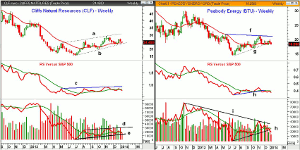
Chart Analysis: Cliff Natural Resources (CLF) was down over 30% in 2013 even though it closed the year above the July lows at $15.32.
- In last year’s column, Big Volume Bombs, I reviewed the very weak technical outlook that did not favor buying CLF.
- The weekly chart suggests that the rally from last summer’s low (lines a and b) is a continuation pattern or just a pause in the downtrend.
- On a break below $19.88, the downside target from the chart formation is in the $11.50 area.
- This corresponds nicely with the 127.2% Fibonacci target.
- The relative performance has had a weak rally (line c) over the past six months and has dropped below its WMA.
- The weekly OBV did confirm the lows and shows a formation, lines d and e, that is consistent with a failing rally.
- The OBV has dropped below its WMA and a drop below the October lows could precede a break of price support.
- CLF is currently trading below its quarterly pivot at $25.02 for the first time since July.
Peabody Energy (BTU) was hammered in 2013 by cheap natural gas prices and low prices for coal. It was down over 25% in 2013 as it made a low of $14.21 last July.
- The rally from these lows peaked at $21.28 in the middle of November and is already down 14% from these highs.
- BTU has been sitting on the weekly uptrend, line g, for the past four weeks.
- A weekly close below $16.71 will complete the flag formation, lines f and g.
- This would protect downside targets in the $12.50-$13.50 area with the 127.2% Fibonacci target at $12.22.
- The relative performance dropped below its WMA and support (line h) at the end of November.
- The RS line has been bumping into its declining WMA for the past five weeks.
- BTU was down 1% on Tuesday and the daily RS line (not shown) has dropped back below its WMA.
- The weekly OBV broke its uptrend, line h, last week as its WMA is flattening out.
- The daily OBV (not shown) has turned down but is still slightly above its WMA and volume increased Tuesday.
- BTU is below the quarterly pivot at $19.17 with projected quarterly pivot support at $17.07.
NEXT PAGE: 1 More Market Dog
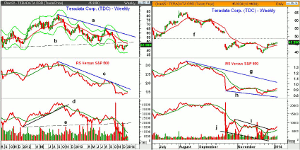
|pagebreak|Teradata Corp. (TDC) is a $7.51 billion dollar global data storage company that was up just 3.4% in 2013. It peaked at $80.97 in September and triggered a weekly low close doji the following week.
- TDC is currently down 43% from the 2012 high and dropped below $40 at the end of 2013 before it rebounded.
- The weekly chart shows that major support at line b was violated as it warned about 3rd quarter earnings and its full year outlook.
- The 20-week EMA is now at $48.12 with further strong resistance in the $49 area (line a).
- The longer-term downtrend, line a, is at $$57.90.
- The relative performance broke its support in the latter part of 2012 and shows a well-established downtrend, line c.
- The RS line is now approaching its declining WMA.
- The OBV broke its uptrend (line d) in October of 2012 and has since formed lower highs and lower lows.
- The volume was very heavy in October as the OBV dropped below important support at line e. It is acting weaker than prices.
The daily chart of Teradata Corp. (TDC) shows the large downside gap in October and has traced out a flat-to-lower trading range since the break of major support.
- So far, it is holding above the rising 20-day EMA at $44.10 with monthly pivot support at $43.53.
- There is further support at $40-$41.50 with monthly projected pivot support at $36.75.
- The daily relative performance has formed lower lows, line h, indicating it is still acting weaker than the S&P 500.
- The downtrend in the RS, line g, is well above current levels.
- The daily OBV has also been leading prices lower as it made lower lows with prices, line j, in early December.
- The OBV is above its WMA and has broken its short-term downtrend, line i.
What it Means: Bottom fishing is often an appealing strategy to some but there needs to be technical evidence to support any decision. As far back as September 2012, the technical evidence did not favor Cliff Natural Resources (CLF), as back then it was one of my 3 High-Yield Disasters even though its high yield tempted some.
The weekly analysis for these three stocks could improve later in the year but currently it suggests that they will move lower in the first part of the year.
How to Profit: No new recommendation.


