In this first full week of trading after the holidays, MoneyShow's Tom Aspray reviews some positions in the Charts in Play portfolio to see if any adjustments are needed.
The stock market tried to stabilize on Friday after starting the New Year on the downside. The majority of the key market averages closed the week with slight losses but the ranges were narrow on the holiday-shortened week.
The negative divergences noted in last week's Too Much Bull? are still intact but have not been confirmed. Two consecutive days on the downside could do it and set the stage for a drop in the S&P 500, at least to the 1800-1810 area.
In the latest reading, 68.5% of the S&P stocks are above their 50-day MAs and the five-day MA has turned lower. In October, 82% were above the 50-day MAs so there are signs that the market has lost strength.
The market-tracking ETFs are still well above their quarterly pivot levels. As I noted last fall, the Spyder Trust (SPY) did not have a weekly close below its quarterly pivot in 2013. For the 1st quarter, the pivot is at $177.97 and I will publish a full table later in the week.
Given the December euphoria, it is important that you continue to monitor your portfolio for warning signs. This is often a combination of a stalling rally and the failure of volume to confirm the price action. Here are two stocks from the Charts in Play portfolio that are sending warnings signals as well as two that continue to act strong.
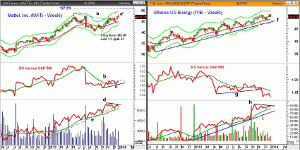
Chart Analysis: Mattel, Inc. (MAT) had a nice eight-week run from the October low of $39.68 to the late November high of $46.50.
- MAT
made another new high last week at $47.97 but closed the week lower, forming a
doji (see arrow).
- A weekly close below $46.66 will trigger a
low close doji sell signal.
- The break of the downtrend, line a, in early September did not trigger the
rally I expected.
- I was looking for a move to the 127.2% Fibonacci
target at $50.90.
- The relative performance is in a very shallow uptrend, line c, and has not
been able to move above resistance at line b.
- A move above this resistance is needed to signal it is a market
leader.
- The weekly on-balance
volume (OBV) peaked in early November but has now formed lower highs, line
d.
- This negative divergence is a concern as is the break of the OBV uptrend,
line e.
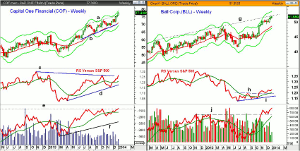
The weekly chart of the iShares US Energy (IYE) shows a well-defined uptrend from the 2012 lows. IYE exceeded the prior week's high by 5 cents last week before closing lower and just above the prior week's low.
- The 20-week EMA was tested four weeks ago with the low at $48.29.
- The weekly uptrend, line f, is now at $47.73 with the October low at
$46.22.
- The relative
performance attempted to bottom in the fall but plunged through support,
line g, at the end of November.
- This indicates that IYE
is acting weaker than the S&P 500.
- The weekly OBV peaked in the middle of October and has formed a negative
divergence, line h, over the past two weeks.
- The OBV is still above its WMA and the uptrend, line i.
- The daily studies (not shown) are both negative.
NEXT PAGE: 2 Stocks That Are Still Strong
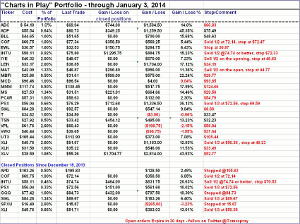
|pagebreak|Capital One Financial (COF) traded in a tight range in the middle of November before turning sharply to the upside. It is up 12.8% over the past three months.
- The October highs were slightly exceeded in early December, but after
consolidating for two weeks, COF
again rallied sharply.
- Last week's close was just below the weekly starc
+
band at $77.42.
- For January, the monthly band is at $82.02 with the quarterly projected
pivot resistance at $83.10.
- The weekly relative performance moved above its WMA in early December and
has now broken through long-term resistance at line c. The WMA of the RS line
is trying to turn up with strong support at line d.
- The weekly OBV closed above long-term resistance at line e last week.
- The OBV has good support at the November lows and more important at line
f.
- The daily OBV and RS analysis (not shown) are both well above their rising
WMA.
- The quarterly
pivot is at $73.48 with stronger support at $71.07.
Ball Corp. (BLL) is a metal-packing provider that closed just barely higher last week as it is testing the resistance, line g, from the prior two highs.
- There is monthly projected pivot resistance at $53.67, which coincides
with the weekly starc+ band.
- The weekly relative performance has completed its short-term bottom
formation, line I, as the resistance (line h) has been overcome.
- The RS
line is well above its now rising WMA.
- The volume was strong last fall as the OBV moved above the resistance,
line j, that goes back to 2012.
- The OBV made new highs last week and is well above its WMA.
- Both the daily OBV and RS lines (not shown) did turn higher on Friday.
- The weekly chart has first support at $50.53 with the quarterly pivot at
$49.27.
What It Means: As part of your investing or trading plan, it is a good idea to monitor your positions on a regular basis. When a market has been moving higher or lower for an extended period of time, a weekly review at a minimum makes sense.
Though there are not yet strong sell signals for either Mattel, Inc. (MAT) or iShares US Energy (IYE), reducing the position size and tighter stops are recommended.
The signs of overall market weakness in early December made me too cautious about holding a full position in Capital One Financial (COF), and we sold half too early. I suggest giving the remaining position a chance to move even higher.
Ball Corp. (BLL) is a tougher call as while the weekly chart shows that resistance is being tested, the bottoming formation in the relative performance and positive OBV favor staying with longs.
How to Profit: No new recommendation
Portfolio Updates: For Mattel, Inc. (MAT), should be long at $42.09 as sold 1/3 the position at $46.33. Would sell ? the remaining position on the opening Monday. Use stop at $44.77.
For iShares US Energy (IYE), should be long from $46.33. Would sell ? the remaining position on the opening Monday. Use stop at $48.83 on the remaining position.
Capital One Financial (COF), should be 50% long from $69.75 as sold half at $72.14. Use a stop at $72.47.
For Ball Corp. (BLL), should be long from $44.65, use a stop at $48.63.
These changes were Tweeted well before the opening.
NEXT PAGE: The Charts in Play Portfolio
|pagebreak|


