As the market continues its relentless advance, its internals also continue to deteriorate, and MoneyShow’s Tom Aspray investigates whether there are still any good buys in one market-leading sector.
Another record close in the S&P 500 on Monday at 1808.37 even though the intra-day high from November 29 at 1813.55 was not surpassed. This was the 39th new closing high for the year in the S&P 500 but from my perspective it was definitely not impressive.
The NYSE A/D numbers were neutral as the NYSE Composite did not make new highs and only 157 stocks made new 52-week highs. This is well below the October reading of 471, and at the November peak, there were 284 new highs on the NYSE. This is a sign that the market’s trend has weakened.
In the latest Week Ahead column, I provided my outlook for how the S&P 500 might close the year, basis a combination of technical and historical analysis. While the S&P 500 closed up 0.18% for the day and the KBW Bank index gained 0.27%, the broader NYSE Financial Index lost 0.98%. Today the Volker rule was scheduled to go in effect but that has been delayed by the impending snowstorm.
On a year to date (YTD) basis, the Select Sector SPDR Financial (XLF) is up 32.5% versus a 29.5% gain in the Spyder Trust (SPY). This makes it a market-leading sector in 2013 but does that mean that XLF or the major money center banks are still a buy now?
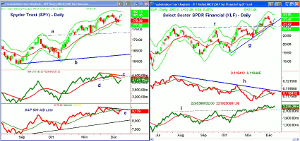
Chart Analysis: The Spyder Trust (SPY) formed a doji on Monday with its close at $181.40, which was just above the prior closing high of $181.
- The intra-day high of $181.67 was just below the November 29 high of $181.75.
- The daily starc+ band is at $182.73 with the monthly projected monthly high at $186.16.
- A daily close below $181.16 will trigger a low close doji sell signal.
- The daily OBV has been rising for the past two days but did break support at line d last week.
- The OBV is still below both its WMA and the bearish divergence resistance at line c.
- Monday’s close was therefore accompanied by the 2nd negative divergence since the November highs.
- The S&P 500 Advance/Decline also has formed another negative divergence, line e, as it has just rallied back to its declining WMA.
- The A/D line also shows a pattern of lower lows.
- The 20-day EMA is at $179.39 with support also at $178.35.
- A decisive break of this level is likely to trigger a drop at least to the monthly projected support at $176.39.
The Select Sector SPDR Financial (XLF) staged a breakout in November as the resistance at line f, was overcome. This support in the $21 area was tested last week.
- There is resistance now at the recent high of $21.64, which corresponds to the quarterly R1 resistance.
- The daily relative performance is still in a downtrend, line h, after leading the S&P 500 from April through July.
- The RS does show a potential bottoming formation but the weekly RS (not shown) is still below its WMA.
- The daily OBV does act better as it made a new high on November 25 and is back above its flat WMA.
- The OBV did break through its resistance, line i, to confirm the price action.
- There is more important support at $20.06, which is the quarterly pivot.
NEXT PAGE: 2 Banks Stocks to Watch
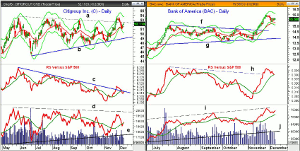
|pagebreak|Citigroup Inc. (C) has kept pace with the XLF, so far in 2013, as the downtrend, line a, was overcome in November when it surged to a high of $53.98 and hit the starc+ band.
- The daily starc- band was tested last week and it is now at $50.28.
- The quarterly pivot is at $49.48 with the daily uptrend, line b, now at $48.94.
- The relative performance moved through its downtrend from the May highs (line c) in late November.
- The OBV did not confirm the upside breakout as it failed to move above the resistance at line d.
- The OBV closed Monday back above its WMA and well above the longer-term support at line e.
- The weekly OBV (not shown) did confirm the breakout in prices.
- There is near-term resistance now at $52-$53.
Bank of America (BAC) has done a bit better in 2013 than Citigroup Inc. (C) as it is up 34.5% versus 31.8%.
- The stock broke out of a four-month trading range, lines f and g, in November.
- The upside targets from the range at $15.20 and $16 have been met.
- The quarterly R1 resistance is at $16.14 with the weekly starc+ band at $16.27.
- The relative performance broke through strong resistance at line h, in November.
- The RS line has pulled back to its WMA but the weekly (not shown) is holding well above its WMA.
- The OBV has been acting strong as it has formed higher highs, line I, and is well above its rising WMA.
- The weekly OBV (not shown) also did confirm the new highs.
- The rising 20-day EMA is at $15.30 with the monthly projected support at $14.41.
What It Means: The further divergences in the daily technical studies increases the odds of a deeper correction over the next few weeks. The extent of the initial selling should give me a clearer idea of how deep a correction should be expected.
As for the financial sector including Citigroup Inc. (C) and Bank of America (BAC), I would not recommend new positions as we should get a better buying opportunity down the road. Of the two banks, Bank of America (BAC) is acting the best.
How to Profit: There are no strong buy signals yet in the inverse ETFs, like ProShares UltraShort S&P 500 (SDS), but they could come later today. Watch my Twitter feed for new recommendations.


