Since gold’s sharp rally from its June lows, MoneyShow’s Tom Aspray has felt that it was a bull trap, not the real thing, and the technical evidence now seems to show that the trap is about to close.
The Transports and small-cap stocks led the stock market higher Monday as both were up well over 1% for the day. This was much better than the 0.36% gain in the S&P 500. The market internals were clearly positive, which has moved the McClellan oscillator back above the zero line but it is still below more important resistance.
The lofty level in the major averages has deterred many from investing in the stock market. The focus is now on the European Central Bank as most expect them to further ease their monetary policy on Thursday. Most of the European stock market averages are lower in early trading as are the S&P futures.
Some analysts and advisors are recommending that with stocks at such lofty levels, gold is the only place for new investments. This is generally based on their fundamental view of the economy. In July, based on the technical evidence, I wondered is Gold’s Rally a Bull Trap? Though the rally lasted longer than I expected at the time, gold’s rally still has that characteristic.
Last week’s decline in gold prices has weakened the technical outlook and indicates that the bull trap is likely to close in the coming weeks.
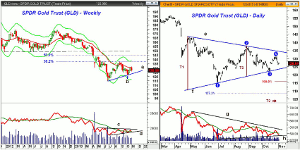
Chart Analysis: The weekly chart of the SPDR Gold Trust (GLD) shows that the rally from the June low of $114.68 just reached the 38.2% Fibonacci retracement resistance at $137.55, which is calculated from the high at $174.07.
- If the August high at $137.55 is overcome, the 50% Fibonacci resistance is at $144.57.
- The rally last week failed at the 20-week EMA, which now stands at $130.16.
- The weekly support is at $123 and a weekly close below $121.85 (point b) will signal that the downtrend has resumed.
- The rally from the June lows was a good trading opportunity but the weekly OBV suggested it would fail as it just reached resistance, line c, that went back to April-May.
- The flag formation on the on-balance volume (OBV) (lines c and d) is consistent with a continuation pattern.
- The OBV may break its support ahead of prices as it is just barely above its WMA.
- Last’ week’s close was on the quarterly pivot at $126.29 with quarterly R1 support at $115.04.
The daily chart of the SPDR Gold Trust (GLD) shows a broad flag formation (lines e and f) that goes back to April.
- A break of the key support at $121.85 (point 3) will complete the formation.
- There are several ways to calculate downside targets based on Fibonacci analysis as well as on the chart formation.
- If the decline from point 4 is equal to the decline from point 2 to point 3, then the 100% Fibonacci projection target is at $115.74.
- Using the rally from point 1 to point 2, the 127.2% Fibonacci retracement target is at $108.65.
- Using the chart, I like to measure the flag at two points, labeled T1 and T2, to obtain two flag formation targets.
- For example, T2 has a length of $18.55.
- When this is subtracted from the breakdown levels at $121.85, you get a target of $103.30.
- On the other hand, the flagpole (R1) has a length of $32.73, which gives a target of $89.12.
- There is initial resistance at $128.80 with monthly R1 resistance at $129.65.
- It would take a strong close above $131.44 to stabilize the daily chart.
- The daily OBV shows a pattern of lower highs (line g) and a break of support at line h will be negative.
NEXT PAGE: Tom’s Gold ETF Pick
|pagebreak|The PowerShares DB Gold Short ETN (DGZ) seeks to replicate the inverse performance of certain gold futures and has an expense ratio of 0.75%. It has an average volume of just over 200K shares.
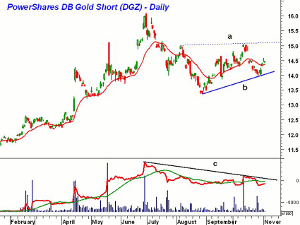
- The June high for DGZ was $16.08 and then the following decline retraced just over 50% of the rally from the 2012 low.
- The quarterly pivot is at $14.68, so a weekly close above this level would be positive.
- The early October high of $15.05 corresponds to the 61.8% Fibonacci retracement resistance from the June high.
- The OBV has formed lower highs (line c) and needs a strong move above this resistance to turn positive.
- The weekly OBV (not shown) is testing its flat WMA.
- There is minor support now at $14.30-$14.45 and then at $14.
- The monthly projected pivot support is at $13.88.
What it Means: The failure of the weekly technical studies to form a convincing bottom last summer and the apparent continuation patterns favors an eventual break to the downside. The strong close in the dollar index two weeks ago suggests that it may have bottomed, which many will also consider a negative for gold prices.
Another bounce is possible over the near term, but in my view, that will be an opportunity to buy an inverse gold ETF. The gold miners are also likely to test the lows from last summer but they may not make new lows.
How to Profit: For the PowerShares DB Gold Short ETN (DGZ), go 50% long at $14.36 and 50% at $14.19, with a stop at $13.73 (risk of approx. 3.8%).
Editor’s Note: If you’d like to learn more about technical analysis, attend Tom Aspray’s workshop at The Trader’s Expo Las Vegas, November 20-23, 2013. You can sign up here, it’s free.


