MoneyShow’s Tom Aspray “gambles” that the much-anticipated US government shutdown will be short-lived and identifies potential buy candidates for the market’s next leg up.
The sharply lower opening Monday was well absorbed by the market with the S&P 500 losing just over 10 points while the small-cap S&P 600 was up 0.19%. The market internals though negative did not reflect any heavy selling pressure.
Now that the shutdown has occurred, the prevailing question is how long will it last? The initial global reaction seems to be “what’s the big deal” as stocks in Europe are showing nice gains in early trading. Even the US futures are higher in early trading.
Still, it is not the time to be complacent as the debt ceiling is a more serious problem looming over the market. The daily technical studies continue to deteriorate so a day or two of heavier selling is still possible. The Spyder Trust (SPY) was down 0.5% and is now below the October pivot at $168.44. The monthly S1 support is at $166.86 with the September low at $163.70
The action of several different market sectors was particularly interesting on Monday as one of the 4 S&P Beating Industry Groups I focused on last week reacted surprisingly well to the impending government shut down.
Chart Analysis: The NYSE Composite closed below the 20-day EMA with the daily starc- band at 9545.
- The daily uptrend, line a, is at 9416 which is just over 2% below current levels.
- The 38.2% Fibonacci support is just above the daily uptrend with the 50% support at 9351.
- The McClellan oscillator declined to -30 on Monday with next support at -100.
- It is still well above both the August and June lows.
- The NYSE A/D line has dropped below its flat WMA but is still well above the positive divergence support at line c.
- There is initial resistance in the 9690-9750 area.
The DJ US Gambling Index (DJUSCA) dropped down to test the support in the 800 area but then rallied to close above 819. It held above the 20-day EMA at 797.
- There is additional support in the 790 area with further at the gap in the 774-780 area.
- The long-term resistance, now support, is in the 740 area, line d.
- The relative performance completed its bottom in early August.
- The RS line has been in a solid uptrend, line e, since August and is also well above its WMA.
- The daily OBV is close to making new highs after breaking through resistance, line f, in early September.
- The weekly OBV and RS analysis have both confirmed the new highs.
- The weekly starc+ band is at 848.
NEX PAGE: 2 Gambling Stocks to Watch
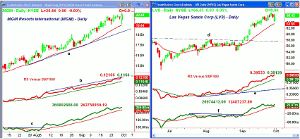
|pagebreak|MGM Resorts International (MGM) has been in a solid uptrend for the past two months.
- MGM dropped to a low of $19.53 and violated the new monthly pivot at $19.64 before closing at $20.44.
- From the June lows at $12.87, MGM is currently up 58%.
- MGM traded as high as $100.50 in 2007 so the major 38.2% is still well above current levels at $39.21.
- The daily relative performance has been above its WMA since late July and shows a clear pattern of higher highs, line b.
- The OBV moved through its resistance, line c, on August 5 and has held well above its rising WMA.
- Once above the prior highs at $20.62, the weekly starc+ band is at $21.43.
Las Vegas Sands Corp. (LVS) also staged an impressive reversal on Monday as it opened at $64.46, which was 2.1% below last Friday’s close.
- By the end of Monday’s trading, LVS closed at $66.43 which was a gain of 0.8% for the day.
- The rising 20-day EMA is at $63.58, which corresponds to the monthly pivot.
- There is additional support at $62.50 and then more important in the $59.80-$60, which includes the projected monthly low.
- The relative performance closed at new highs on Monday and has been above its WMA since late August.
- The RS line has long-term support now at line e.
- The daily OBV broke out to the upside (line f) on September 4 and has turned up from its rising WMA.
- The weekly OBV (not shown) has also confirmed the new highs so both time frames are positive.
- The weekly starc+ band is at $68.88 but in 2007 LVS had a high of $147.86.
- The major 50% retracement support is therefore at $74.32, which is a reasonable upside target.
What it Means: The stock market’s short-term momentum is negative but clearly the technology and small-cap sectors are bucking the trend. Making a list of those stocks that are acting much better than the S&P 500 as the market corrects should help you create a good buy list for when the market turns higher.
The major averages are still showing double-digit gains for the year, and in last Friday’s analysis, I made the case while these gains are likely to be maintained into the end of the year.
Both MGM Resorts International (MGM) and Las Vegas Sands Corp. (LVS) are too far above the September lows and reasonable stop levels to consider new positions. If the ranges narrow in these stocks, then new positions may be considered.
How to Profit: No new recommendation for now.


