Yesterday, the selling in the stock market continued, but MoneyShow's Tom Aspray is looking for industry groups, like these four, that are outperforming the S&P 500.
The selling in the stock market continued Monday, but the major averages did close off their worst levels. So far this looks like a fairly normal correction, with the major averages holding above stronger support and their rising 20-day EMAs.
The home builders were one of the weakest industry groups, losing1.71% ahead of today’s S&P Case–Shiller Housing Price Index. An hour later we get the latest reading on Consumer Confidence. Also weak Monday were the KBW Bank Index and the Philadelphia Gold/Silver, down 1.64% and 1.74% respectively.
The majority of the daily technical studies are still positive, but declining, therefore, it should still be considered a buying opportunity for strong stocks that are pulling back to support. The starc band analysis of the Nasdaq 100 stocks highlighted several such stocks.
When a market corrects, it is a good idea to watch for industry groups that are outperforming the S&P 500 or the Spyder Trust (SPY). So far in September, the SPY is up 3.8%, while for the past thirty days, the top industry groups have done four times better. Here are four S&P beating industry groups to keep any eye on for new opportunities.
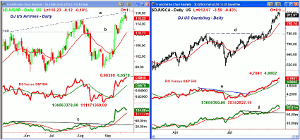
Chart Analysis: The DJ US Airlines Index (DJUSAR) is up 15.6% since the end of August and the daily chart shows that the trend line connecting the May and August highs, line a, was tested last week.
- There is minor support now in the 114-114.80 area.
- Additional support in the 110.75-111 area, line b, and the rising 20-day EMA.
- The relative performance has been rising sharply all month, indicating that the airlines have been leading the overall market.
- The daily on-balance volume (OBV) broke through resistance, line c, in late August.
- The OBV did confirm the new highs last week and is well-above its WMA.
- The weekly technical studies (not shown) are positive and still rising.
- ARR Corp. (AIR) and Delta Air Lines (DAL) are leading the major airlines higher.
The chart of the DJ US Gambling Index (DJUSCA) shows that it broke through resistance, line d, on September 5 and is up 11.4% so far in September.
- The industry group made a short term peak last Thursday.
- The rising 20-day EMA is at 780.74 and then at the gap in the 774-780 area.
- The relative performance led prices higher as it moved above resistance, line e, in early August.
- The breakout in prices was confirmed by the OBV, which also overcame the resistance at line f.
- The weekly studies (not shown) are positive, as they are well above their rising WMA.
- There is major resistance from the 2007 highs in the 830-895 area.
- Las Vegas Sands (LVS) and MGM Resorts International (MGM) have broken above resistance in the past month and drop back to the breakout levels.
NEXT PAGE: Two More Indices to Watch
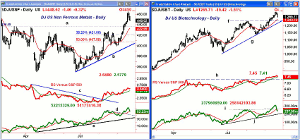
|pagebreak|The DJ US Non Ferrous Index (DJUSNF) is up 11.7% so far this month, even though it has corrected 3.4% from last week’s highs.
- There is next good chart support, line a, at 436.45.
- The 20-day EMA is at 432.99, while the 38.2% Fibonacci retracement support from the June lows is at $421.06.
- The uptrend, line b, and the 50% retracement support are now at 399-407.58.
- The relative performance completed its bottom formation in early August as the downtrend, line c, was broken.
- The RS line has made higher highs with prices.
- The OBV was much stronger than prices at the June lows, line e.
- On September 10, the OBV broke though its short term downtrend.
- Once above the recent high at 464.70, the next major resistance from 2012 is in the 534-547 area.
- The high in 2011 was 767, while in 2007, the index reached 782.
- Freeport-McMoRan Copper & Gold Inc. (FCX) is probably the best known member of this index.
The DJ Biotechnology Index (DJUSBT) is up just over 7% so far this month, but was hit fairly hard Monday, losing 1.5%.
- The 20-day EMA is at 1243 with the August highs, line f, at 1232.
- The daily uptrend is a bit lower at 1212.
- The relative performance overcame the resistance going back to April, line h, in early September.
- The OBV also confirmed the upside breakout as it moved above the prior highs at line i.
- The OBV has dropped below its WMA, but is still above support at line j.
- The weekly studies (not shown) have confirmed the recent highs.
- There were quite a few smaller biotech stocks that moved higher Monday on stronger than expected volume.
What it Means: These four industry groups have been leading the market higher, and the stocks that are part of these indices are likely to be market leaders once the market correction is over.
For the airlines, the merger between AMR and US Airlines is still in doubt, though they extended the merger’s termination date this week.
Biotechnology has been a favorite industry group for the past two years, and I am always looking for new mid-cap or larger stocks in this industry group.
How to Profit: No new recommendation.


