Since gold rallied strongly from its July lows, many have wondered whether it was strong enough to reverse the major trend, and MoneyShow’s Tom Aspray takes a technical look to see whether you should be buying gold or the gold miners now.
The stock market was finally hit with profit-taking Thursday but the selling was not heavy. After the nice run from the late August lows, a pullback was overdue as the investors become even more skittish as we get closer to next week’s FOMC meeting.
The positive action in the technical studies suggests that a pullback should not be too severe and also not last too long. I would look for both the key ETFs and the stronger stocks to find support at their rising 20-day EMAs. It would take a sharp decline to reverse the signs that the market was bottoming.
Before the summer started, I recommended that the best course of action would be to “summer proof” your portfolio and take a cautious approach to the markets during the summer markets. This included adjusting the maturity of your bond portfolio, as well as preparing your portfolio for a 5-10% correction. We have not seen the stronger correction that I feared in May.
I also did not participate in the sharp rally in both gold and the gold miners from the late-June lows. Even though the metals were reaching a strong seasonal period the OBV did make new lows with prices, which was not consistent with a major low.
For the past two months, I have thought that the rally in the SPDR Gold Trust (GLD) was a bull trap while the action in the miners as of early September was looking more positive. The gold futures plunged Thursday down over $33 and are down over $11 in early trading. So has the technical outlook or my recommendation change?
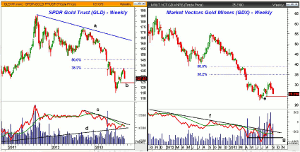
Chart Analysis: The weekly chart of the SPDR Gold Trust (GLD) shows that it made a high of $174.07 in October 2012, forming a doji. The following week, an LCD sell signal was triggered.
- The rally from the low at $114.68 just reached the 38.2% Fibonacci retracement resistance from the October high.
- The reversal this week is clearly a sign of weakness though volume has not been too heavy yet.
- The weekly OBV barely rallied during the summer as it just barely made it above the declining WMA.
- The OBV is now back below its WMA and looks ready to test long-term support at line d.
- There is key resistance for the weekly OBV at line c.
- As I tweeted Wednesday, the daily OBV was breaking its uptrend, which was a negative sign.
- The OBV multiple time frame analysis, therefore, points lower.
- The key support is now at $123.55 and a weekly close under this level will increase the odds that the lows will be tested.
- The monthly pivot resistance is at $131.91.
The Market Vectors Gold Miners (GDX) rallied from a June low of $22.21 to a high on August 27 when a daily LCD was triggered.
- The rally in GDX fell well short of the 38.2% retracement resistance in the $35 area.
- The initial support at 427.05 has been broken with the monthly projected pivot low at $24.23.
- There is more important support at $23.89, line e, which is now a key level to watch.
- The weekly OBV broke its major downtrend, line f, in August which was a sign of strength.
- The OBV is likely to close back below its rising WMA this week.
- The OBV has next important support at the April low, line g.
- The daily OBV (not shown) is below its WMA and has broken initial support.
- There is initial resistance at $27.50 with more important at $29.
What It Means: Of course, gold like the rest of the world markets is waiting for the FOMC announcement next week. In order to support my view that the gold miners are bottoming, we need a higher weekly close in the next two weeks.
Both buy levels in GDX have been hit and we have no positions in GLD. I hope those who were long the Market Vectors Junior Gold Miners (GDXJ) took some profits or raised their stops.
Portfolio Update: For the Market Vectors Gold Miners (GDX), now 50% long at $26.74 and 50% long at $25.22, with a stop at $23.77.


