Against the backdrop of the today's disappointing economic data and earnings releases, MoneyShow's Tom Aspray examines the key measures of the market's health to see what they are telling us now.
The market was under a bit more selling pressure on Wednesday, which livened the debate in the financial media. Some experts shared their fundamental reasons why the stock market was the only place to invest, while others warned that a 1987-style crash was possible as they pointed to the large bearish position of George Soros.
The fundamental case I have found to be rarely valuable on a short-term basis. If you look at the market bottoms in December 2012 or in June 2012, the fundamentals looked pretty bad and did not encourage buying. These were great buying opportunities.
I have never seen any consistent way to predict that a market correction will turn into a market crash. It can be a win-win PR move if you happen to be right because you may be able to capitalize on it for decades as many have. If you are wrong, no one is likely to remember. Do you remember those who were warning of a crash early in 2013?
One thing that is clear is the weak technical outlook for some of the market-leading sectors such as the homebuilders, as well as the corrective patterns in the retail sector. These are just some of the signs that the market has lost its upside momentum.
So far, the market has paid little attention to the weak technical outlook for the bond market as rates look poised to jump to new highs before the month is over.
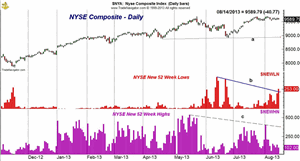
The chart above shows the NYSE Composite along with the number of stocks making new 52-week lows (in red) and the number of new highs (in purple). The number of new lows has been increasing since early August and has just moved through the downtrend from the June highs.
Also, the number of stocks making new highs has deteriorated since May, line c, and has not been confirming the price action. In May, 536 stocks made new highs with just 402 on August 1. Tuesday was even more unusual because while the NYSE Composite closed higher, there were more stocks making new lows (198) than there were making new highs (139).
So what are the other key measures of the market's health telling us now? Should we be prepared for just a summer cold or a more serious bout of walking pneumonia?
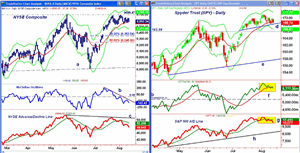
Chart Analysis: The NYSE Composite has been holding above its 20-day EMA for the past six days with short-term support now at 9535 and then 9460.
- Using the early August high and the late June low, the 38.2% Fibonacci support is at 9353 with the 50% support at 9246.
- There is still key resistance at the May intra-day high of 9695.
- The McClellan Oscillator has been deteriorating for some time as it dropped below the zero line on
July 26.
- The oscillator shows a pattern of lower lows and is now slightly oversold at -146. On June 5, the oscillator hit -311.
- The NYSE Advance/Decline has formed lower highs and is acting weaker than prices.
- Early in the year, it was acting stronger than prices.
- The A/D line dropped below its WMA over two weeks ago and is now clearly in a downtrend and well below its WMA.
The chart of the Spyder Trust (SPY) shows that it is also just sitting on the 20-day EMA with minor trend line support (line d) now at $168.
- The daily starc band is at $166.81 with further chart support at $165.99.
- There is additional support at $164 and then in the $162 area. This is 2.8% to 4% below current levels.
- The support connecting the April and June lows, line e, is now at $158.
- The on-balance volume (OBV) did confirm the recent highs but has now dropped below its WMA.
- The indicator is now looking more toppy (line f).
- The S&P 500 A/D line looks much weaker as it has formed lower lows and is now well below its flat WMA.
- The A/D line has more important support at line h.
What it Means: The two-week deterioration in the stock market is consistent with a 5-8% market correction and should begin with a stronger down day and then a one-two-day rebound. This type of market decline is what one may call a “summer cold.”
The fact that the McClellan oscillator is already somewhat oversold does allow for another push to the upside and possibly new highs in some of the market averages. This, in my opinion, would be more negative and set the stage for a double-digit-size market drop that may make investors think they have walking pneumonia. Typically, when a market rally lasts much longer than expected, the ensuing correction takes the market low enough to change the sentiment so that most are then afraid to do new buying.
How to Profit: Once there is a break of short-term support, then the following rebound should be an opportunity to buy some of the inverse ETFs. Stay tuned as new recommendations are likely to go out first on Twitter.


