MoneyShow's Tom Aspray explores whether the long-awaited market top is finally here and what to expect next from gold and the miners.
The Dow Industrials and S&P 500 both closed lower for the second day in a row. The market internals were about 3 to 1 negative with more stocks on the NYSE making new lows than new highs.
Stocks in Asia were hit hard again as the yen moved higher and Japan’s Nikkei 225 lost 4%. Also heavy selling in Hong Kong as the Hang Seng was 1.5% lower. In Europe, stocks are down slightly as are the US futures.
The selling was much heavier in the precious metals as the SPDR Gold Trust (GLD) was down almost 1.4% while the Market Vectors Gold Miners (GDX) lost 5.5%. The selling was less heavy in silver as the iShares Silver Trust (SLV) was down just under 1%.
As I noted in Friday’s Week Ahead column, there were some signs that the stock market was losing upside momentum and some investors are wondering if a top is now in place. Those who went bottom fishing in the precious metals last month were likely shaken by Tuesday’s sharp decline but are these markets vulnerable to even lower prices?
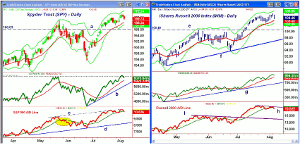
Chart Analysis: On the daily chart of the Spyder Trust (SPY), this week’s decline looks pretty insignificant as it is still above its 20-day EMA at $168.34.
- The next support is at $167.52, which was the late July low. It is about 1.3% below current levels.
- The more important support is in the $166 area, line a, which corresponds to the mid-June highs.
- The daily OBV made marginal new highs last week, confirming the price action.
- The OBV is holding well above its rising WMA and the uptrend, line b.
- The S&P 500 A/D line made marginal new highs last week (line c) but closed Tuesday below its WMA.
- A drop below the most recent lows will increase the odds of a further correction.
- The highlighted action of the A/D line in May is typical of what you would expect to see before a more extensive correction.
The iShares Russell 2000 Index (IWM) made a new high Monday and then closed Tuesday below the lows of the prior two days.
- The 20-day EMA at $103.40 is not far above the most recent swing low at $103.
- The daily starc- band is at $102.46 with a more important level of support in the $100.49 area, line e.
- The daily uptrend, line f, is now at $96.63 with the quarterly pivot at $96.03.
- The daily OBV made clear new highs over the past few days and is still in an uptrend, which supports the positive price action.
- The Russell 2000 A/D formed lower highs last week, line h, as it has formed a negative divergence.
- The A/D line is below its WMA and negative A/D numbers today could drop it below the late July lows.
- The A/D line has more important support at line h, which was the breakout level.
NEXT PAGE: What it Means
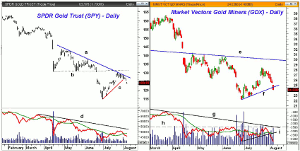
|pagebreak|The SPDR Gold Trust (SPY) hit a low of $114.68 at the end of June and 16 days later on July 23 reached the quarterly pivot at $129.89 where the rally stalled.
- The daily chart shows that the downtrend (line a) was also tested but the rally stalled below the resistance at $131.20, line b.
- The uptrend in GLD, line c, was broken on August 1.
- The gold futures are down another $6 in early trading and GLD has next support in the $121.40-$122.70 area.
- There is more important support in the $116-$117 area, which is a likely downside target.
- The daily OBV did make a new low with prices in late June before moving above its WMA on July 10.
- The OBV dropped below its WMA just ahead of Tuesday’s drop.
- Initial resistance is now at $126 and the flat 20-day EMA.
The Market Vectors Gold Miners (GDX) also had a sharp rally from the June lows and the rally high at $28.35 was just above the quarterly pivot at $28.03.
- GDX failed well below the major resistance in the $30 area.
- GDX has already dropped over 15% from its July 23 high as the uptrend, line f, has been broken.
- There is next support at $23-$22.21 and the June lows.
- The daily OBV reached converging resistance, lines g and h, before it turned lower.
- The uptrend in the OBV, line i, was broken on August 1, which warned of lower prices.
- The OBV has already dropped below the June low, which is a negative sign.
- The first resistance is at the gap in the $25.02 to $25.34 area with the declining 20-day EMA at $26.
What it Means: The daily technical studies on the NYSE Composite look weaker than those on either the SPY or IWM. The McClellan oscillator rallied back to the zero line last week and now shows a clear downtrend. Its A/D line also looks a bit weaker.
The OBV on the ETFs are still positive, which is not consistent with a major decline from current levels. Therefore, the stock market appears to be consolidating now and could drop back to the mid-June highs over the next few weeks. This would be a decline of 2-3%. The action over the week should clarify the outlook.
In a July 25 column, I explained why the rally in gold looked like a “bull trap.” This is where prices rally far enough to entice some to buy just as the rally is faltering.
Gold and the gold miners still look vulnerable over the next few weeks. There is likely to be a rebound in the next week but would then expect another wave of selling. The June lows are likely to be tested and GDX could break to new lows.
How to Profit: No new recommendation


