For those who have stayed on the sidelines as the stock market climbed relentlessly, MoneyShow's Tom Aspray offers some tips for putting your money to work.
Sluggish jobs growth did not dampen the enthusiasm for the stock market as the Dow Industrials rose for the sixth week in a row. The bond market was also quite volatile as yields backed off the Thursday’s highs but still closed the week higher.
Those not invested in stocks were bombarded last week with the serial bears dominating early in the week while the bulls took over the market commentary after the week’s close.
With the Spyder Trust (SPY) up 7.6% from June 25 and now over 11% above its 200-day moving average, is buying Monday’s opening really a good idea? Analyzing the risk is a key step to take before any investment or trade as I discussed a few weeks ago.
My review of the daily technical studies in Friday’s Week Ahead column concluded that they were positive overall yet there were some slight divergences in the NYSE Composite and Russell 2000 that need to be watched. The seasonal outlook for August was also reviewed and it indicated market averages are vulnerable.
In the July 26 column, I again advocated a strategy for those who were not yet invested in stocks. This generated quite a few questions, so I wanted to explore this more in depth and give some specifics for those who were considering this approach.
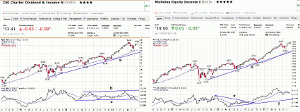
Chart Analysis: On December 6, I discussed four dividend and income funds, one of which was the Rochdale Dividend & Income (RIMHX), which is now called the CNI Charter Dividend & Income.
- I featured charts from stockcharts.com where one can do analysis similar to the relative performance analysis that I feature on a regular basis.
- RIMHX has risen from the December 7 close at $29.55 to Friday’s close at $33.59.
- Including the dividends of $0.81, it is up 16.4% during this period.
- The chart shows a well-defined uptrend, line b, though RIMHX has not yet exceeded the May highs.
- RIMHX was not a favored fund in December as its relative performance was in a trading range,
lines b and c. - The support at line c, has now been broken, indicating it is acting weaker than the S&P 500.
- At the top of the charts there is data from Morningstar.com (a great resource), which shows the current yield of 3.25%, its relatively high expense of 1.38%, and additional information.
Nicholas Equity Income I (NSEIX) was a fund I liked in December as it is a mid-cap value five-star fund that was yielding 2.75% with expenses of 0.79% and a low minimum of $500. It now yields 1.75%.
- NSEIX closed at a new high of $19 last Friday, which is up 18% from the December 7 close at $16.10.
- When the dividends of $0.75 are included, it is up 22.6% during the period.
- The weekly chart shows a strong uptrend, line d, with a June low of $17.50 and the 40-week MA at $17.05.
- This MA was tested last November and the weekly uptrend, line d, still looks strong.
- The relative performance broke its downtrend, line e, in early October.
- This was a sign that NSEIX was starting to lead the S&P 500 higher.
- The RS line shows a strong uptrend, line f, and it did confirm the May highs.
- It has turned higher and has moved above its MA.
NEXT PAGE: How to Profit
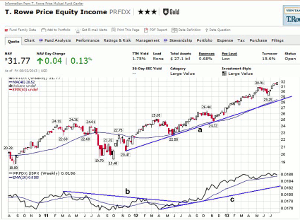
|pagebreak|T. Rowe Price Equity Income (PRFDX) was another favored fund last December. It is a large-cap value fund that yields 1.75% with expenses of 0.68%. It is one of the largest funds in this category with assets now over $27 billion. That is up $3 billion from last December.
- It closed December 7 at $26.31 and has paid dividends since then of $0.42.
- With Friday’s close at $31.77, and including the dividends, it is up 22.3%.
- The fund has moved well above the May high at $30.91 with a low in June of $29.25.
- PRFDX is now up 8.6% from the late June low, which is not a bad yearly return.
- The uptrend from the late 2011 low, line a, and the 20-week EMA are now in the $28.52 area.
- The RS line broke though 14-month resistance in July 2012 and has stayed above its EMA.
- There is longer-term support now at the uptrend, line c.
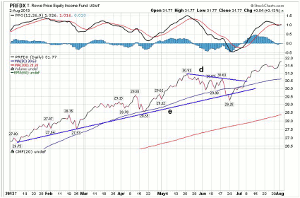
Also as part of the Gallery View on stockcharts.com, you also get a daily chart with both a 50- and 200-day MA.
- Above the chart is their PPO or Percentage Price Oscillator, which is very similar to the MACD and MACD-His.
- The crossover signals are the same but there are some subtle differences.
- As of Friday’s close, the PPO was slightly negative but is not yet showing any increase in downside momentum.
- The daily chart shows that the short-term downtrend, line d, was broken in early July.
- The uptrend from the January and February lows was broken briefly in June.
- The 50-day MA is now at $30.63, which is 3.6% below Friday’s close.
- The 200-day MA is at $28.38, which 10.7% below the close last Friday.
What it Means: Both Nicholas Equity Income I (NSEIX) and T. Rowe Price Equity Income (PRFDX) are viable candidates for a dollar cost averaging plan. This is when you invest equal amounts on a regular basis over a period of time no matter what the market is doing.
A correction is inevitable before the end of the year, and while the major averages may not end the year above their current levels, many stocks will be higher. In 2014, the major averages should be higher than they are now.
How to Profit: As I again recommended Friday “Decide how much you want to invest in total and then break it into five equal parts. Invest the first on August 12 and then equal amounts every two weeks. This will make you fully invested by early October, which will make you invested before a seasonally strong period.”
For example, let’s say you want to invest a total of $10,000. Therefore, you would invest $2,000 on August 12; $2,000 on August 26; $2,000 on September 9; $2,000 on September 23; and then $2,000 on October 7. Of course, the actual dates or the time between investments are not important as the key points are to make regular investments so that you are not buying at a market high.
This could also be done with a well-diversified or market-tracking, low-expense ETF as long as no commissions were paid. Most major brokerage firms, like Schwab offer a wide range of commission-free ETFs.
My trading lesson Learn to Drive Your Own 401k gives you further examples of the RS analysis that can be used to manage your 401K.


