Since this sector has outperformed for the last few years, MoneyShow’s Tom Aspray examines the charts to see whether it still makes sense to be in this sector or if it’s time to move on.
The current fragile state of the US stock market was highlighted Monday when the S&P futures dropped 15 points in 60 minutes as stocks dropped in an apparent reaction to an article in the Financial Times on what the Fed might do.
Stocks in Asia were mixed overnight and are slightly higher in Europe as are the US futures. Today, we get the latest reading on the Consumer Price Index and Housing Starts along with the beginning of the FOMC meeting.
From a technical perspective, it is still my view that it would take “two consecutive days of solid price gains along with strong A/D numbers” to indicate that the correction was over.” Clearly volatility has picked up but it is difficult to determine whether the bullish sentiment has decreased enough to support a new phase.
The healthcare sector has exceeded almost all expectations in the past few years. As I noted last December, the sector broke 12-year resistance in 2012, which suggested it should also be a strong performer in 2013. Many are now wondering whether they should stick with the healthcare sector, take profits, or look for new health care stocks to buy.
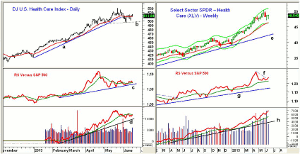
Chart Analysis: The daily chart of the DJ Health Care Sector (DJUSHC) shows that it broke its daily uptrend, line a, in early June but has bounced nicely from support at line b.
- There is further support in the 490 area and the rising 20-week EMA (not shown).
- The minor 38.2% support is now in the 482 area, which is about 5.7% below current levels.
- The relative performance peaked in April but still has been able to hold above its uptrend, line c.
- Volume picked up Monday, and the OBV is very close to moving above its WMA.
- The weekly OBV (not shown) did confirm the recent highs and is well above its rising WMA
- A close back above 527 should confirm the uptrend has resumed
The Select Sector SPDR Health Care (XLV) is up over 21%, so far, this year and the weekly chart shows that the starc+ band was tested a few weeks ago.
- From the May 22 high at $50.40, it corrected 6.4% to a recent low of $47.16.
- There is monthly pivot support now at $46.47 with quarterly pivot support at $44.23.
- The long-term support, line e, is in the $42.50 area.
- The weekly relative performance shows a longer-term pattern of higher highs and higher lows.
- The RS line has turned up from its WMA and moved through short-term resistance at line f.
- The weekly OBV completed its bottom formation in December, point c.
- The OBV made further new highs last week and continues to lead prices higher.
- The weekly starc+ band is at $50.96 for this week.
NEXT PAGE: A Stock to Buy on Pullback
|pagebreak|One healthcare stock that looks good is AmerisourceBergen Corp. (ABC), which is a $12.85 billion provider of drug distribution and related healthcare services. It has current yield of 1.5%.
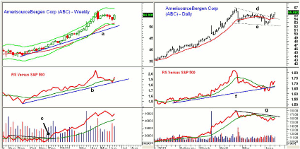
- The weekly chart shows that after the high in April of $56.91, it has stayed in a narrow range with a low last week of $52.38.
- The rising 20-week EMA is at $51.47 with the uptrend, line a, at $50.
- The relative performance moved back above its WMA last week and now has support at line e.
- The weekly OBV did confirm the recent highs and turned up last week. It is well above its WMA.
- The weekly starc + band is at $57.90
The daily chart of AmerisourceBergen Corp. (ABC) shows that the short-term flag formation, lines d
and e, was completed last week. The initial upside targets are in the $58.50-$60 area.
- The 20-day EMA was tested last Thursday and it closed strong Monday.
- The daily relative performance suggests that the correction is likely over as it has moved back above its WMA.
- The daily OBV is now testing its WMA and a break through the resistance at line f will confirm the completion of the continuation pattern.
- There is minor support now at $55 with better at $54.20-$54.50 that includes the monthly pivot.
- More important support is in the $53 area.
What it Means: The longer-term trend for the healthcare sector is positive and the more narrowly focused Select Sector SPDR Health Care (XLV) is also holding up pretty well. It is a more defensive sector, and the recent correction may have been enough to set the stage of another rally.
AmerisourceBergen Corp. (ABC) looks attractive technically but option traders apparently are bearish as there was purchase of a large number of August $50 puts recently that would break even at $49.12. I would look to buy on a pullback but would cancel the order if the recent highs are tested first.
How to Profit: For AmerisourceBergen Corp. (ABC), go 50% long at $54.52 and 50% long at $53.67, with a stop at $51.28 (approx. risk of 5%). Cancel the order if $56.42 is hit first.
Portfolio Update: Should be still long the Select Sector SPDR Health Care (XLV) from $38.50, with a stop at $45.79. I have taken some profits on the way up.


