With volatility making a comeback in the market, MoneyShow's Tom Aspray examines the technical action and sees several stocks exhibiting formations forewarning of further corrections ahead.
The stock market opened higher Wednesday with positive market internals, but soon after the opening, the rally fizzled. All of the major averages closed about 1% lower, and once again, the market internals were weaker than prices. The declines led the advances by a 3-1 margin.
Once again, the Asian markets were hit hard with the NK225 down over 6%. This takes the Japanese market back to stronger support. The Japan-focused ETFs that I like best for the intermediate term will likely gap to the downside and reach more important support. The stock index futures are slightly lower in early trading.
The technical action suggests the market is still vulnerable over the near term as the S&P 500 could drop back to the 1580-1586 area, and the Spyder Trust (SPY) could test the $158-$158.50 and the daily starc- bands before we get an oversold bounce.
A number of stocks appear to be forming double tops, and this makes them especially vulnerable in a weak market. Holders of these stocks should act accordingly, and I hope you have already summer-proofed your portfolio as I recommended in late May.
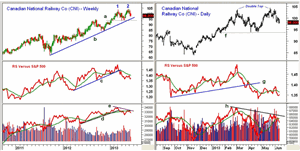
Chart Analysis: Canadian National Railway Co. (CNI) is a $41.5 billion company with extensive US interests that currently yields 1.70%. The weekly chart of CNI shows that it made a high in early March at $103.70 (point 1).
- In the latter part of May (point 2), CNI made a slightly higher high at $104.43.
- The weekly uptrend, line b, is now at $95.28 with the key support from the double-top formation (line a) at $93.87.
- A weekly close below this level will complete the top with downside targets in the $83.30 area.
- The relative performance broke its uptrend, line b, in the middle of March.
- The RS line just rebounded back to its declining WMA as CNI was making new rally highs. This was a sign that it was no longer a market-leading stock.
- The uptrend in the OBV, line c, was broken in March.
- Therefore, it was not surprising that the OBV formed a negative divergence at the May highs, line d.
It is always good to look at multiple time frames as the daily top formation looks quite a bit different on the daily chart.
- The importance of the support at $93.87, line e, is well defined on the daily chart.
- The daily relative performance broke its uptrend, line f, on March 22.
- The RS line was quite weak as CNI was making new rally highs.
- The daily OBV formed a slight negative divergence at the early March highs, which is the basis for the downtrend, line g.
- The OBV formed much lower highs in late May so the bearish divergence was more pronounced.
- The daily OBV is below its WMA and the multiple time frame analysis of the OBV is therefore negative.
- There is initial resistance now in the $100.60-$101.42 area.
NEXT PAGE: 1 More Vulnerable Stock
|pagebreak|Conmed Corporation (CNMD) is an $886 million dollar medical appliance and equipment company, which yields 1.90%.
- CNMD made an initial high of $34.48 at the end of March.
- The higher highs the last week of May (line a) were followed by a lower weekly close.
- The key support is at $30.71, and a weekly close below this level projects a decline to $26.75.
- The relative performance has formed sharply lower highs, line d, and is back below its WMA.
- The weekly on-balance volume (OBV) just formed a slight negative divergence at the highs, line e, and the OBV is now testing its WMA.
- The daily OBV (not shown) is still above its WMA and did confirm the recent highs.
- There is initial resistance now at $33.10 to $33.40.
The Manitowoc Company Inc. (MTW) is a $2.48 billion farm and construction machinery company. Just two weeks ago, it made new a new rally high at $21.50 (point 2).
- This was just above the prior high (point 1) at $21.35.
- The key support for the double-top formation, line f, is at $16.34.
- The uptrend that goes back to the 2011 lows, line g, is now at $14.86.
- The completion of the double top has downside targets in the $11.20 area.
- The relative performance did not confirm the recent highs, line h.
- There is important support for the RS line at line i.
- The weekly OBV dropped below its uptrend at the end of April.
- The OBV formed much lower highs (point 2) as it was diverging from prices.
- This increases the likelihood that support will be broken.
What it Means: Double tops can often lead to very sharp declines, but sometimes what appears to be a double top, can be part of a continuation pattern if the key support holds. All three of these stocks look vulnerable to further selling. The weekly negative OBV divergences observed in both CNI and MTW increases the odds that their double-top formations will be completed.
The McClellan Oscillator closed Wednesday at -284, just above last week's low at -311. This low is likely to be broken before we get another rally.
How to Profit: No new recommendation


