The stock market extended losses for the second day in a row, and MoneyShow's Tom Aspray takes a technical look to see what investors and traders could expect in the days ahead.
The weak close in the stock market Tuesday was a classic sign that the rebound from last Thursday's oversold low was over. Most of the index tracking ETFs gapped lower on the opening but then rebounded until just after lunch as the gaps were filled. The afternoon selling resulted in most of them closing on the day's lows.
Overseas markets are mixed with greater that 1% drops in Hong Kong and Shanghai while the Eurozone markets are slightly higher; nice gains also in the stock index futures with little in the way of economic data today.
The late-day decline was in line with the very weak market internals, especially the NYSE A/D ratios as there were 645 advancing stocks and 3458 declining. The number of NYSE stocks making new lows also surged to 261 with just 35 stocks making new highs. On May 15, there were 517 NYSE stocks that made new highs. The market internals were therefore weaker than prices.
Does this mean that investors should be prepared for a further wave of heavy selling or are we going to see a rebound and more chopping trading instead before stronger levels of support are tested?
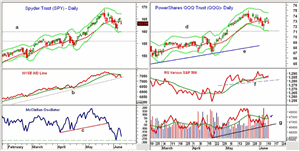
Chart Analysis: The daily chart of the Spyder Trust (SPY) shows that the rally appears to have stalled at $165.40, which was below the stronger resistance in the $166 area.
- The close was back below the flat 20-day EMA at $163.90 with next support at $162.73 to $161.27.
- There is more important support still at $159.71 and the April highs. This also corresponds to the daily starc- band.
- The more important 38.2% Fibonacci retracement support is at $155.94.
- The NYSE A/D line rebounded back to its flattening WMA and is now testing its uptrend.
- A decisive break of this support will be consistent with a further decline.
- The McClellan oscillator rallied from last week's low of -311 and hit -97 last Friday.
- The oscillator has now dropped back to -222, and if it turns higher, it will indicate a postponement of a further decline.
The daily chart of the Powershares QQQ Trust (QQQ) shows that Monday's high at $73.76 was just below the June 4 high of $73.82.
NEXT PAGE: Tom's ETF Buy Recommendation
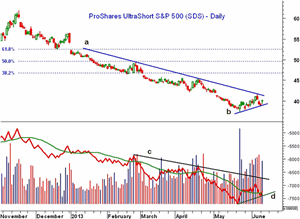
|pagebreak|The ProShares UltraShort S&P 500 (SDS) is a very liquid double-short ETF that I recommended buying at noon yesterday.
What it Means: When I started this column, the S&P futures were up four-five points but they are now up close to 10 points with just 60 minutes before the opening.
It is, of course, today's close that will be most important but the early action does suggest that those on the sidelines are buying. The action of the A/D line does not yet suggest that the correction is over as it is acting weaker than prices, rather than stronger. I would look for this relationship to change before a significant new uptrend gets underway.
A strong close today could signal a rally back to or above Monday's highs before we see another wave of selling. Choppier trading will help to lessen the recent enthusiasm for stocks. As I discussed in the most recent Week Ahead column, I still think a sharper decline is required to turn the sentiment bearish enough to form a sustainable market bottom.
I would stick with the long position in the inverse ETF and watch the close.
How to Profit: Should be long the ProShares UltraShort S&P 500 (SDS) at about $39.55, per yesterday's tweet. I would keep the stop at $38.29 for now, which is a risk of about 3.2%.


