The Japanese market reacted immediately to the uncertainty over the Fed's future action as the Nikkei 225 reversed sharply on May 23. Moneyshow's Tom Aspray views this correction as a buying opportunity because once the correction is complete the recent highs should be overcome later in the year.
The Nikkei 225 was up almost 5% in Monday's trading as it reacted positively to the strong close in the US market last Friday. As I discussed in the Week Ahead column, the technical evidence does not yet confirm that the correction is really over.
There was a mixed close Monday in the US market and the NYSE A/D ratio was negative all day, which is consistent with a failing rally. The overnight decision by the Bank of Japan not to implement further stimulus has pressured stocks with the Nikkei closing lower.
A weak close Tuesday in the US averages, especially below last Friday's lows will confirm that the correction has resumed. The next drop should provide a buying opportunity in the Japan-targeted ETFs, and the charts reveal some attractive levels where new buying should be considered.
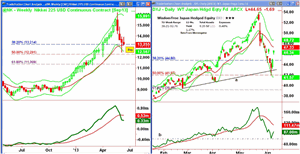
Chart Analysis: The weekly chart of the Nikkei 225 futures reflects Tuesday's trading and shows we are currently lower for the week.
- The chart also reveals the wide range last week as it hit 12,490 before closing at 13,420.
- The decline therefore dropped prices between the 38.2% and 50% Fibonacci retracement support levels.
- I think it is likely that the correction will last a few weeks longer and drop prices back into the 12,400-12,900 area (see box).
- There is further important support in the 12,000 area, which was the low in early April.
- The weekly OBV confirmed the highs in late May but has now dropped below its WMA.
- The daily OBV (not shown) is also still well below its WMA.
- There is resistance now at 13,895-13,940 area.
The WisdomTree Japan Total Dividend Index (DXJ) has a current yield of 1.17%, trades an average of over seven million shares per day, and has an expense ratio of 0.48%. The ETF uses futures contracts to neutralize its yen exposure.
- In May, DXJ had a high of $53.95 and a low last week of $42, which was a drop of 22%.
- At last week's low, the daily starc- band was tested with the 50% retracement support at $41.97.
- The uptrend from the February and April lows, line a, was broken on the decline.
- There is additional support at $40.73, which was the early April low.
- Both the weekly and daily OBV did confirm the recent highs but both are still below their WMAs.
- The daily on-balance volume (OBV) has turned up from support (line b) but the gap between it and the declining WMA suggests it will take some time before it can turn positive again.
- There is initial resistance now at $47 with the monthly pivot at $48.83.
NEXT PAGE: Another Japan-Focused ETF to Buy on Next Dip
|pagebreak|The WisdomTree Japan SmallCap Dividend (DFJ) has assets of almost $259 million with a yield of 2.05%. Its expense ratio at 0.58% is a bit higher than DXJ.
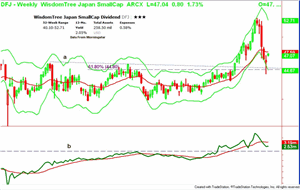
- DFJ peaked in early May at $53.01 and dropped to a low of $44.07 last week.
- This was a decline of 16.8% from the highs though DFJ did have a low of $39.81 in 2011.
- The March 2012 high at $45.68 and the 61.8% retracement support at $44.80 were both broken last week.
- Prices did test the weekly starc+ band at the highs, which were confirmed by the weekly OBV.
- The OBV is below its WMA but is holding above the most recent lows.
- The quarterly pivot is at $46.14 with further support in the $45.50 area.
What it Means: A drop back towards the recent lows in both DXJ and DFJ is likely before a bottom is complete. Given the panic level of selling at the recent lows, they may hold on a further decline.
A retest of the recent lows should be buying opportunity as I expect the NK225 to be higher by the end of the year:
How to Profit: For WisdomTree Japan Total Dividend Index (DXJ), go 50% long at $44.54 and 50% long at $43.26, with a stop at $41.41 (risk of 5.7%).
For WisdomTree Japan SmallCap Dividend (DFJ), go 50% long at $45.66 and 50% long at $44.76, with a stop at $43.63 (risk of 3.5%).


