MoneyShow's Tom Aspray conducts a technical examination of the key industry groups in the transportation sector to help develop a strategy for adding further positions.
Thursday's upside reversal and higher close had those on financial TV shaking their heads. It was not surprising from a technical perspective as after Wednesday's close there was clear evidence that the market was close to a short-term low.
Of course, the market was nervously waiting for the monthly jobs report, which came in a bit better than expected. The futures are higher and a positive close Friday will increase the odds of a further rally next week. Unless the A/D ratios are really strong (4-1 positive of better), the rally is likely to fail.
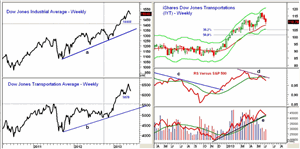
One market sector that I am watching closely is the Dow Jones Transportation Average as its upside breakout in early December combined with the new highs in the A/D line favored double digit gains in 2013. The Transports and Industrials are still in sync, yet there are key levels that should not be broken on a weekly closing basis.
From the November lows to the May highs, the iShares Dow Jones Transportation (IYT) was up 37.5% versus a 25.5% gain in the Spyder Trust (SPY). There were two Transport industry groups that did even better and identifying where their corrections should end will allow one to participate in their next rally phase.
Chart Analysis: The weekly close charts of the Dow Jones Industrial Average and Dow Jones Transportation Average shows the upside breakout to new all-time highs.
- Their uptrends are clear with weekly support at 14,444, which was the last swing low.
- The longer-term support for the Industrials, line a, is in the 13,500 area.
- The Transports have twin lows from April at 5878, which are now the key weekly close support.
- The long-term support line for the Transports is at 5200.
- The weekly closing all-time high is at 15,180 for the Industrials and at 6549 for the Transports.
The weekly chart of the iShares Dow Jones Transportation (IYT) is updated through Thursday and the week's low at $109.25 was fairly close to the 20-week EMA, which is now at $108.18.
- From the May 20 high to Thursday's low was a decline of 6.8%.
- The monthly pivot support stands at $107.47.
- The 38.2% Fibonacci retracement support is at $105.28, which is just below the weekly starc band at $105.76.
- The long-term downtrend in the relative performance, line c, was broken in December confirming the price action.
- The RS line did form a negative divergence, line d, at the recent highs and is now below its WMA.
- The weekly on-balance volume (OBV) did confirm the highs and is now testing its uptrend, line e, and the rising WMA.
- There is next resistance in the $111.80-$112.40 area with further at $114.40.
NEXT PAGE: 2 Sub-Sectors to Watch
|pagebreak|
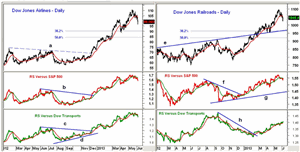
The Dow Jones Airline Index peaked at 110.70 on May 15, which was a rise of over 81% from the November 2012 lows. At Thursday's low, it was down 7.5% from the highs.
- There is further support now in the 96.90 to 93.30 area with the 38.2% retracement support at 90.37.
- The price chart shows the move through resistance, line a, in December.
- The relative performance versus the S&P 500 confirmed the price action.
- The RS line did confirm the recent highs.
- It is often quite interesting to look at the relative performance of an industry group versus its sector.
- This allows you to find the best industry groups in the best sector.
- In green I have plotted the relative performance of the airline index to the Transports.
- It was in a clear uptrend last fall (line d) and also overcame its resistance at line c in December.
- The weekly RS versus the S&P 500 has dropped below its WMA but it has not versus the Transports.
The Dow Jones Railroads Index at its May high of 1097.48 was up over 40% from the November low. It has dropped 6.4% from its high with next support at 1010, which was the late March high.
- The breakout level, line e, is at 967 with the 38.2% Fibonacci support just a bit lower at 962.
- The 50% retracement support is at 920.
- The relative performance versus the S&P 500 formed a bullish divergence, line g, at the November lows.
- The downtrend, line f, was broken in early December.
- The relative performance of Transports versus the S&P turned positive in December but the railroads did not start to outperform the Transports until early February.
- This was signaled by the break of the downtrend, line h.
- The RS line versus the Transports still indicates that the railroads are a market leading sector.
What it Means: Though we may see some weaker than expected economic data over the next month or so, I expect further growth going into year end. This is bullish for the Transports.
Therefore, I am looking for signs that the Transports have completed their correction as that would be a buying opportunity for the airlines and railroads.
I still expect it to take some more time before the correction is complete so after the current rebound is over, I will be watching the next decline closely.
How to Profit: I have no new recommendation for now, but I will be looking for a bottom in the iShares Dow Jones Transportation (IYT) in the $105-$107 area.
Editor's Note: Soon after this article was released, an astute follower pointed out that I had previously recommended IYT on May 7. For the iShares Dow Jones Transportations (IYT), go 50% long at $110.18 and 50% long at $109.42, with a stop at $105.44.” He was correct that this order should have been filled on June 5, one day before the order expired.


