Against the backdrop of a stock market notching all-time highs for the fifth day in a row, MoneyShow's Tom Aspray conducts a review of the Charts in Play portfolio, with updates on some holdings.
From last Friday's sharply higher open, the Spyder Trust (SPY) has closed higher for the past four days, gaining 2.2% so far in May. The tech sector has started to catch up as the Powershares QQQ Trust (QQQ) is up 2.8% so far this month.
The market internals have remained strong and the number of new highs on the NYSE Wednesday was 505, which is the highest level for the year. The new highs had been diverging from prices, but are not now, which is a further bullish signal.
Once you start a new month, it is always instructive to look at the past month's recommendations to see which ones worked as planned and review those that did not. One can learn from both these picks and pans, as in investing or trading, there is always room for improvement.
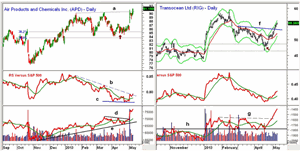
Chart Analysis: Air Products and Chemicals Inc. (APD) is part of the materials sector, which has just broken out of major resistance. It was recommended on April 10.
- APD dropped back into the 38.2% support level several days later hitting the buy level (see arrow).
- APD has just closed above resistance at line a, completing its four-month trading range.
- The quarterly R2 resistance is at $92.89 with the upside targets from the chart formation in the $96-$97 area.
- The daily relative performance had been forming a base (line c) that was confirmed by the break of its downtrend, line b.
- The daily OBV was acting stronger than prices at the March highs and then pulled back to test its uptrend, line e, at the April lows.
- The on-balance volume (OBV) broke through its resistance last week, line d, as the volume was heavy.
Transocean Ltd. (RIG) was recommended on April 9 as it was a favorite stock of Carl Icahn. The stock plunged just after it was recommended as it dropped below its daily starc- band.
- The correction did hold above the 61.8% Fibonacci support before it reversed to the upside.
- The move through resistance at $53.40, line f, confirmed that the correction was over.
- The daily starc+ band is being tested with the February highs at $59.50.
- The major 50% retracement resistance is at $62.50.
- The daily relative performance moved above its WMA on April 24.
- The daily OBV broke through its major resistance, line g, at about the same time.
- The weekly OBV (not shown) is also positive so the multiple time frame OBV is positive.
NEXT PAGE: Update on 4 Holdings
|pagebreak|
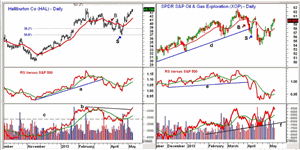
Halliburton Co. (HAL) was one of my oil sector recommendations at the end of March and it dropped into the buying zone in early April.
- After a sharp rally to above the previous high, the sellers came back in as the 50% Fibonacci support was broken (see arrow).
- This also hit the stop at $36.92 as the low was $36.77.
- The relative performance had broken its uptrend, line a, on the correction but the weekly RS line had confirmed the highs.
- On the correction, the daily OBV dropped briefly below the long-term support, line c.
- The weekly OBV (not shown) was much stronger than prices in February and just dropped below its WMA on the correction.
- Both the daily RS and OBV analysis are now positive as the OBV has just broken out (line b).
- There is initial support at $41-$42 with the quarterly pivot at $39.79.
Also recommended at the same time as HAL, was SPDR S&P Oil and Gas Exploration ETF (XOP) hit a high of $62.66 in the middle of March but it also had a much sharper correction that I expected.
- It dropped to a low of $54.06, which was a drop of 13.7% from the highs.
- The recommended buy level was hit just before the uptrend, line d, was broken.
- The stop at $57.25 was hit just a few days later (see arrow).
- XOP then had an impressive rally back to strong resistance and closed back above its 20-day EMA for a few days before plunging again.
- The relative performance now is trying to bottom out but the weekly (not shown) is still negative.
- The daily held its support, line f, on the correction and now shows a pattern of higher highs.
- XOP is now back to resistance in the $60-$61 area.
What it Means: The positive outlook for Air Products and Chemicals Inc. (APD) has just been confirmed, and it now has a 6% profit. I will be looking to take some profits on this position at the chart formation targets.
Transocean Ltd. (RIG) is acting well with a $125 profit, and I recommend below to sell half at higher levels.
As for Halliburton Co. (HAL), in hindsight I should have had a wider stop or a lower buying level that was in between the 38.2% and 50% support levels. Alternatively after the first bounce from the 38.2% support, the stop could have been raised to limit the damage.
Given the strength of the overall market and the seasonal positives for the oil sector, I was looking for a brief correction in SPDR S&P Oil and Gas Exploration ETF (XOP). It turned out to be much more complex but the stop was tight enough to limit the damage.
How to Profit: No new recommendation.
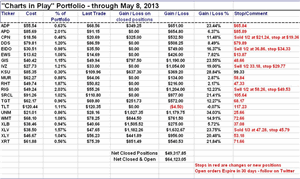
Portfolio Update: For Air Products & Chemicals (APD), we are 50% long at $85.86 and 50% long at $85.36. Stop now at $85.89.
For Transocean Ltd. (RIG), we are 50% long at $49.54 and 50% long at $48.84. Sell half at 58.26, use a stop $49.53.
For Halliburton Co. (HAL), the 50% long from $39.72 and $38.62 were stopped at $36.92 for a 5.6% loss.
For SPDR S&P Oil and Gas Exploration ETF (XOP), the 50% long at $60.24 and at $59.48 were stopped out at $57.25 for a loss of 4.3%.
NEXT PAGE: The Charts in Play Portfolio
|pagebreak|


