The better-than-expected US Non-Farm Payroll data fueled yet another stock market rally Friday, and MoneyShow’s Tom Aspray, identifies four attractive candidates to buy on pullback.
The strength in the equity markets carried over to the Asian markets Monday with the Shanghai Composite up over 1% and the Hang Seng not far behind. The European markets are slightly lower in early trading as are the US stock index futures.
The weekly technical studies, including the upside breakout in the Powershares QQQ Trust (QQQ) discussed in the weekend report, do favor further gains this month though a short-term pullback is likely this week.
Even though the SPDR Diamond Trust (DIA) closed at new highs, it is still 2.3% below its monthly starc+ band. Surprisingly, there are a number of Dow stocks, based on the monthly starc band scan that are moderately oversold.
Those stocks that are closest to the lower or starc- band are considered to be better risk buys than if they are trading near the upper or starc+ bands. But before you buy, you also need to look at the volume and relative performance analysis, and then assess the risk.
At the top of the most oversold list is Exxon Mobil Corp. (XOM), which closed at $88.99, 14% above its monthly starc- band at $76.91. It is 13% below its monthly starc+ band, which implies there is significant upside potential before it would reach overbought levels.
On the other side of the coin, there were three stocks that closed the month above their monthly starc+ band; they were: Johnson and Johnson (JNJ), Verizon Communications Inc. (VZ), and The Walt Disney Co. (DIS). This places them at the top of the most overbought list, but that does not mean they cannot still go higher. The problem is that the risk of buying them at current levels is too high.
This month, the most interesting stocks are on the oversold list, and there are four I will be watching.
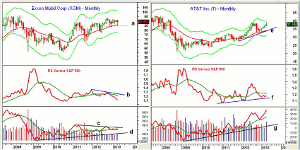
Chart Analysis: Exxon Mobil Corp. (XOM) had a wide range last month as it had a sharp drop in the middle of the month when it hit a low of $85.02, which was below the prior three month lows.
- Now, the $84.70-$85.02, line a, is the key level of support to watch.
- The highs in 2012 was $93.97 with the all-time high from 2008 at $96.12.
- The monthly relative performance formed lower highs (line b) before dropping back below its declining WMA.
- The weekly and daily RS lines have turned up but need to improve further to bottom out.
- The monthly OBV is neutral as while it closed just barely below its flat WMA, it has been in a narrow range so far in 2013.
- The monthly OBV has important support at line d and resistance at line c.
- The weekly OBV (not shown) is very close to moving back above its WMA while the daily is positive.
- Friday’s close was right on the quarterly pivot of $90.02.
AT&T Co. (T) was one of my favorite stocks in 2012 as it had a nice run from below $30 to over $38. The monthly chart shows that it had a high in April of $39 two weeks ago and then closed at $37.04.
- This close was below the prior week doji’s low of $37.55 so a LCD sell signal was generated.
- The quarterly pivot is at $36.28 with more important monthly support at $35.
- The monthly uptrend and the 20-month EMA are both at $33.61.
- The month relative performance has stayed below its WMA for the past few months and has important support at line f.
- The weekly RS line shows a more positive pattern.
- The monthly OBV tested its rising WMA last December before moving sharply higher.
- The new highs in the OBV are sending a bullish signal while the weekly OBV (not shown) is also positive.
- There is resistance now at $38.28 to $39.
NEXT PAGE: 2 More Stocks to Watch
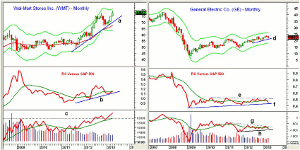
|pagebreak|Wal-Mart Stores (WMT) made new highs in April at $79.50 when it slightly exceeded the 2012 highs.
- WMT is well above its monthly uptrend at $70.90 and further above the 20-month EMA at $67.66.
- The relative performance shows a short-term uptrend, line b, and is close to moving back above its WMA.
- The weekly RS line (not shown) is looking much more positive as it is well above its rising WMA.
- The monthly OBV broke through the resistance from 2009 last year and has now confirmed the breakout by moving to significant new highs.
- The weekly OBV (not shown) has also confirmed the new price highs.
General Electric Co. (GE) has been in a shallow uptrend for the past 11 months, line d. The major 50% Fibonacci retracement resistance at $23.87 was slightly exceeded before the recent drop.
- The quarterly S1 support at $21.11 was tested two weeks ago.
- There is further support now at $20.26, which is the low for 2013.
- The monthly relative performance is just slightly below its WMA but still above the long-term support at line f.
- A move in the RS line above the resistance at line e, would be very positive.
- The OBV has just dropped below its WMA and has formed slightly lower highs, line g.
- There is key OBV support at line h.
- The weekly studies do look more positive and the weekly starc- band was tested two weeks ago.
What it Means: Several of the stocks on this list did close near the month’s lows, which increases the odds of some downward pressure over the near term.
The oil sector may have turned the corner, and the 2.8% yield on Exxon Mobil Corp. (XOM) also makes it attractive on a pullback. Our former position was stopped on the mid-April drop.
I also like the 4.8% yield on AT&T Co. (T), but would only buy where a stop under long-term support can be used.
How to Profit: For Exxon Mobil Corp. (XOM),I would go 50% long at $88.86 and 50% long at $87.56, with a stop at $84.33 (risk of approx. 4.4%).
For AT&T Co. (T), I would go 50% long at $36.34 and 50% long at $35.78, with a stop at $34.77 (risk of approx. 3.5%).
Portfolio Update: Should be still long Wal-Mart Stores Inc. (WMT) from $68.03 as sold half at $78.55 or better. Use a stop at $72.66.


