After putting in a strong performance in 2012, the technology sector has been struggling so far this year, and MoneyShow’s Tom Aspray examines the charts for clues on whether upcoming earnings announcements can provide the much-needed catalyst for a rally.
Stocks closed with slight gains Monday, but for a change, the Dow Industrials lagged up just 0.14%, which was one-third the 0.47% gain in the S&P 500. The market internals were clearly positive and leading the market was the Nasdaq 100, which was up over 1%.
Asian markets were hit hard overnight with over a 2.5% loss in the Shanghai Composite but the Euro markets are so far ignoring the losses in Asia as they are up nicely. The focus this week is on the tech sector as the much weaker than expected earnings from International Business Machines (IBM) shocked many analysts.
On the other hand, the earnings from Microsoft Corp. (MSFT) were a positive surprise as its stock has gained over 7% in the past two days. Today the focus will be on Apple, Inc. (AAPL), who along with AT&T (T), reports after the close.
There are a number of tech companies reporting this week including Juniper Networks, Inc. (JNPR), which reports after the close today, while Lexmark International, Inc. (LXK) reports before the opening. Later in the week, we have Amazon.com, Inc. (AMZN) and Chinese internet giant Baidu, Inc. (BIDU).
Oftentimes, the technical studies can alert investors and traders to post-earnings shocks and the technical outlook for Apple, Inc. (AAPL) and two other tech stocks could help set the tone for this week’s trading.
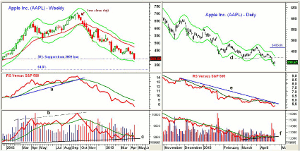
Chart Analysis: The weekly chart of Apple, Inc. (AAPL) shows that an LCD was triggered one week after AAPL made its high last September.
- AAPL close below its 20-week EMA the week ending October 20 as the decline picked up momentum.
- The weekly starc- band was tested for two consecutive weeks in early November before AAPL rebounded for two weeks.
- The stock is down over 44% from its highs and is testing the major 50% Fibonacci support from the 2008 lows at $391.64.
- The 61.8% support level is at $347.566, which corresponds to the lows from early 2011.
- The weekly relative performance broke its uptrend, line a, in October and has continued to make lower lows.
- The weekly OBV did make new highs with prices, line b, in September, which was misleading.
- The OBV dropped below its WMA in the middle of October but reached long-term support, line c, in March.
- The volume was high on last week’s decline so a sharply higher close on higher volume is needed to turn the OBV around.
The daily chart of Apple, Inc. (AAPL) shows the break of support, line d, in the $420 area last week.
- AAPL has been testing its daily starc- band over the past few days, which reflects its short-term oversold status.
- The daily OBV dropped below its support, line f, last week so the multiple time frame OBV analysis is negative.
- AAPL dropped below its quarterly pivot in late October 2012 and has been below its quarterly pivot line ever since.
- There is resistance now at $420 and then $437 with the quarterly pivot at $465.86
NEXT PAGE: 2 Tech Stocks with Upside Potential
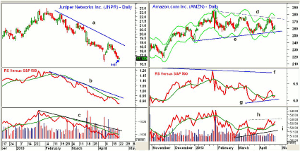
|pagebreak|Juniper Networks Inc. (JNPR) is an $8.72 billion developer of network and communication devices that peaked in February at $22.98.
- The February high was well above last fall’s high but below the 2011 high of $45.01.
- JNPR is trying to hold above the early April low of $16.75 with the monthly S1 pivot support at $16.65.
- The relative performance analysis still looks weak as it topped out in February.
- The RS line is below its WMA and the downtrend, line b, making new lows on Monday.
- The OBV is also below its downtrend (line c) and its WMA but is still above the early April lows.
- JNPR formed a doji on Monday so a close above Monday’s high at $17.24 would trigger a daily HCD.
- There is further resistance at $17.70 to $19.05, which is April’s high.
Amazon.com, Inc. (AMZN) reports its earnings on Thursday afternoon and most are expecting earnings to drop as they also missed in the first quarter.
- The daily chart shows that prices have been in a flag formation, lines d and e, since last December.
- Prices are now testing the lower boundaries of the formation in the $255 area with the daily starc- band at $252.
- The 50% retracement support level is at $251.39 with the quarterly S1 pivot support at $247.55.
- The relative performance turned up Monday and has formed a short-term uptrend, line g.
- There is major resistance for the RS line at line f.
- The OBV tested its rising WMA last week and has turned up. It has further support at line i.
- The OBV has short-term resistance at line h.
- The quarterly pivot is at $266.13 and a close above $277.40 would be an upside breakout with targets in the $292-$294 area.
What it Means: Clearly, strength in the tech sector would be a big plus for the overall market so this week’s earnings and the tech stocks’ reaction to the earnings will tell us more.
For Apple, Inc. (AAPL), the expectations are so low that a rally would not be surprising. From a technical standpoint, a sharp rally is needed just to start the bottoming process.
For Juniper Networks, Inc. (JNPR), the close will be interesting as a close above $17.24 would be a positive sign.
Amazon.com, Inc. (AMZN) has the best looking daily technical outlook while the weekly studies need a strong weekly close to turn positive.
How to Profit: Aggressive traders, go 50% long Amazon.com, Inc. (AMZN) at $260.84 and 50% at $257.20, with a stop at $249.33 (risk of approx. 3.7%).


