At a time when the Dow and S&P are notching daily record highs, MoneyShow’s Tom Aspray examines the charts of four leading sectors for signs of topping.
Stocks added to their gains Thursday as last Friday’s weak job report seems to be forgotten by investors .The market internals were strong again Thursday with 2,474 stocks advancing but just 1,525 declining. Today, we get new data on retail sales, consumer sentiment, business inventories, as well as earnings from two key financial firms.
Despite the gains in the Dow Industrials and S&P 500, the two previously market leading averages I focused on in yesterday’s Buy, Sell or Hold, are still lagging. If they close sharply lower Friday, it will suggest that the market is ready for a pullback.
All, except two of the Select Sector SPDR ETFs that I regularly follow, had double-digit gains in the first quarter. Late last year, many were wondering whether we would see these types of gains for the entire year.
Leading the list is the Select Sector SPDR Health Care (XLV), which as up 15.4% for the quarter and has added another 4.6%, so far, in April. It has been a favored sector since May 2012 and was included in my Best Sector Bets list for 2013.
There are four other sectors that are up over 2% in April, led by the Select Sector SPDR Utilities (XLU), which is up 3% in April and 15% for the year. With the S&P 500 at new all-time highs, which sectors are likely to do the best in the 2nd quarter and which ones are ready to correct?
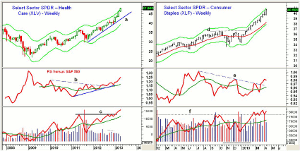
Chart Analysis: For the Select Sector SPDR Health Care (XLV), I have chosen to feature a monthly chart even though the month is not even half over.
- XLV is currently trading well above the monthly starc+ band at $46.26 and also closed above it in March.
- It is also exceeded the quarterly R1 level at $47.91 that was noted last week.
- The monthly relative performance is still rising strongly consistent with a market leading sector.
- The weekly and daily RS lines have also confirmed the highs and multiple time frame RS analysis is important.
- The monthly OBV broke through two year resistance, line c, at the end of January and continues to look strong.
- Seasonally, the health care sector tops out at the end of April with first support now in the $46-$46.70 area and more important in the $45 area.
The Select Sector SPDR Consumer Staples (XLP) was up 14% in the first quarter as it surpassed the October 2012 highs, line d, at the end of January.
- XLP is very close now to both its weekly and daily starc+ bands with its quarterly R1 at $41.28.
- The weekly relative performance broke its downtrend, line e, just four weeks ago and is testing the late 2012 highs.
- The on-balance volume (OBV) overcame its long-term resistance in February, line f, and is well above its WMA.
- The daily OBV (not shown) has confirmed the highs this week.
- There is first support at $39.50 with the monthly pivot at $39.15.
NEXT PAGE: Should You Take Profits Now?
|pagebreak|
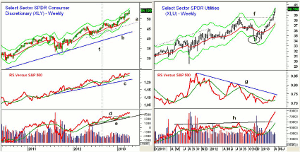
The Select Sector SPDR Consumer Discretionary (XLY) also had a good 1st quarter gaining 11.7% and so far is up over 14% for the year.
- XLY is still below the weekly star+ band with the quarterly R1 at $54.68 and the monthly starc+ band at $55.03.
- The weekly technical studies turned positive at the start of September 2012.
- The relative performance has continued to confirm the market highs and has stayed above its rising WMA.
- The weekly OBV broke through four month resistance, line d, in mid-January and is making new highs this week.
- The OBV is well above its uptrend (line e) but the daily OBV (not shown) has not yet surpassed the March highs.
- There is first support at $53 with the monthly pivot at $52.13. The long-term uptrend is in the $50 area.
The Select Sector SPDR Utilities (XLU) dropped back to its weekly starc- band in the middle of November as many were concerned about the potential of much higher taxes on dividends.
- Just three weeks ago, XLU surpassed the highs from the summer of 2012 at line f.
- The relative performance moved above its WMA in early February but is still below its long-term downtrend, line g.
- The daily RS analysis shows a more convincing bottom formation.
- The OBV has been very strong in 2013 as it moved above the 2011-2012 highs, line h.
- It is looking a bit overextended as it is well above its rising WMA.
- The daily OBV (not shown) shows no signs yet of a top.
- There is minor support now at $39.28 with more important at $38.50 and the quarterly pivot at $37.78.
What it Means: The top performing sectors, so far in 2013, do not show signs of topping yet but are well above good support making new longs at current levels too risky.
The daily technical picture of the Select Sector SPDR Financial (XLF) and the Select Sector SPDR Industrials (XLI) are looking more vulnerable.
As I noted on Wednesday, the Select Sector SPDR Materials (XLB) need a strong rally to keep its uptrend intact.
How To Profit: I will be looking to take some more profits in the Select Sector SPDR Health Care (XLV) once I see signs of a daily top.
Portfolio Update: We are still long the Select Sector SPDR Health Care (XLV) at an average price of $38.50 and sold 1/3 at $42.78. Use a stop for now at $42.35.
For the Select Sector SPDR Consumer Discretionary (XLY), we are at $46.67 with a stop at $49.22.
We are also long the Select Sector SPDR Materials (XLB) from $38.46 with a stop at $37.08.


