As the market continues to grind higher, it is getting more difficult to find bargains, so MoneyShow’s Tom Aspray looks at the charts of a topping sector in search of buying opportunities.
The major averages have had a choppy week and may finish the week on a negative note as stocks were sharply lower again in Asia. This could be a positive for the stock market’s intermediate-term outlook.
Though most Wall Street pros are looking for a correction, they are looking to buy when stocks drop and think stocks will be even higher in the coming months. This typically causes choppy markets especially as we head into the end of the month with too many money managers under invested.
This week’s air pockets in Federal Express (FDX) and Oracle Corporation (ORCL) both down over 11% is the last five days may be giving a few bulls some doubts. Still, I think it will take either a sharper 200+ point decline in the Dow or a longer period of choppy downward trading to increase the bearish sentiment.
Since the start of 2012, the Dow Jones Biotechnology Index (DJUSBT) is up 66%, but there are now signs that this index and two of the leading biotechnology ETFs may be ready for a correction, but will it be a buying opportunity?
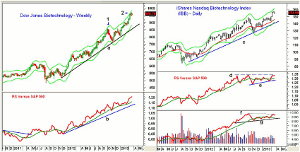
Chart Analysis: The Dow Jones Biotechnology Index (DJUSBT) has been in a powerful uptrend since the late 2011 lows, line a.
- The new highs in the past three weeks tested the weekly starc+ band (point 2).
- At the September highs, the weekly starc+ band was also tested, point 1, and then a sharply lower close signaled that a correction was underway.
- The correction lasted five weeks and at the November 2012 lows, the weekly starc- band and the uptrend were both tested.
- The relative performance bottomed out in May 2011 as the downtrend was broken and the RS line started a new uptrend.
- The RS line made a new high this week and is well above its rising WMA.
- The RS line is well above its weekly uptrend, line b.
- There is first good support in the 880-920 area, which is 5-6% below current levels.
The iShares Nasdaq Biotechnology Index (IBB) has also come close to its weekly starc+ band over the past few weeks.
- Last week IBB formed a doji and a close at current levels on Friday would complete a John Person LCD top formation.
- There is next support at $148-$150 with the 20-week EMA at $145.60.
- The uptrend (line c) and the lower starc- band are now in the $139.80-$140.20 area.
- The weekly relative performance did not make a new high with prices, line d, and now has support at line e.
- The OBV also has formed a bearish divergence, line f.
- A drop in the OBV below the support at line g, would confirm the divergence.
- The recent high was at $157.25 with the starc+ band at $160.
NEXT PAGE: Topping Sector ETF
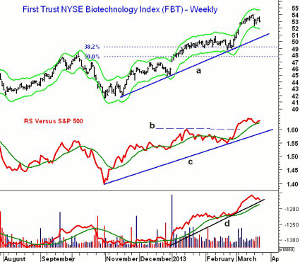
|pagebreak|The First Trust NYSE Biotechnology Index (FBT) is up 28% from the October low of $41.44.
- A week ago, FBT made a high of $54.05 and Monday reached the daily starc- band.
- The daily uptrend, line a, is now at $50.80, which corresponds to the February highs.
- The 38.2% Fibonacci support level is at $49.23 with the 50% support at $47.68.
- The relative performance broke through resistance, line b, at the start of March.
- The RS line confirmed the recent highs before turning lower, and it is now testing its WMA.
- More important support at line c.
- The on-balance volume (OBV) did confirm the recent highs but is now close to support at line d. The OBV’s WMA is also still rising.
- There is initial resistance at $53.73-$54.05.
What it Means: The biotechnology group has a seasonal tendency to peak early in the year and then bottom during the summer months. In 2012, the February highs started a period of consolidation that was completed by early July.
The longer-term outlook for this sector does look strong, so if a weekly top is confirmed then the ensuing correction should be a buying opportunity.
How To Profit: No new recommendation for now.


