Being in the right sector since the bull market started in March 2009 has made a big difference in your portfolio’s performance and MoneyShow’s Tom Aspray reviews what signals identify the market leading sectors.
The S&P 500 came close to its all-time high last Friday, as the Spyder Trust (SPY) reached a high of $156.80, just below the all-time high of $157.52 from October 2007.
However, new highs look unlikely Monday, as the S&P futures opened ten points lower in reaction to an EU proposal to tax bank deposits in Cyprus to help fund their bailout. Euro bond yields have spiked, though so far the losses in Europe are not nearly as bad as the 2.71% drop in Japan’s Nikkei-225. The stock index futures have rebounded from their early lows, but still the pressure is likely to be on the downside in early trading.
Since the March 2009 lows, there have been only a few sectors that have outperformed the Spyder Trust (SPY) and also have made new all-time highs.
The Select Sector SPDR Consumer Discretionary (XLY) has been a top performer, up 237% since the March 2009 lows. It is also 29.2% above its all-time high from 2007.
The Select Sector SPDR Financial (XLF) is up 214%, but is still 51% below its 2007 high of $38.15. The third best was the Select Sector SPDR Industrials (XLI), which has gained 177%, considerably better than the 132% gain in the Spyder Trust (SPY).
The Select Sector SPDR Technology (XLK) was up 143% at its September 2012 high, but is now up only 131%, just slightly worse that SPY. A look at the weekly charts of the top sector ETFs highlights the technical signals that you should look for that will help keep you in the best sectors.
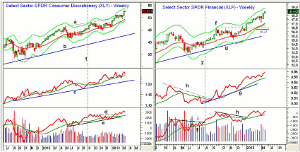
Chart Analysis: The Select Sector SPDR Consumer Discretionary (XLY) had a very tight range last week as it formed a doji.
- This is a sign of indecision. According to John Person’s LCD (low close doji), a close below $52.43 will generate a sell signal.
- The breakout above resistance (line a) has targets as $53, with the weekly Starc+ band at $53.97.
- The weekly chart of XLY shows several periods of consolidations within the overall uptrend.
- In September (line 1), the relative performance moved back above its WMA, signaling that it was again leading the S&P 500.
- The RS line has confirmed the recent highs, with long-term support at line c.
- The weekly OBV broke out of it is resistance ahead of prices last summer.
- The OBV staged another rally early in 2013 when resistance at line d, was overcome.
- There is first support at $51.30-$51.50 with stronger in the $50 area.
The Select Sector SPDR Financial (XLF) closed near the highs last week, with the weekly Starc+ band now at $18.89. The major 38.2% resistance from the 2007 high at $18.20 has been overcome. So far in 2013, XLF is up 12.6%.
- The 50% retracement resistance is at $22.02.
- The downtrend in the weekly relative performance (line h) was broken in September.
- The RS line has been in a solid uptrend since last fall and is well above the uptrend (line g).
- The weekly OBV broke through its resistance (line i) several weeks ahead of prices. The weekly OBV staged another breakout in early 2013 as resistance (line h) was overcome.
- The OBV has just recently bounced off its rising 21-day WMA.
- There is first good support at $17.57, which is the monthly pivot.
NEXT: A Look at 2 More Talked-About Sectors
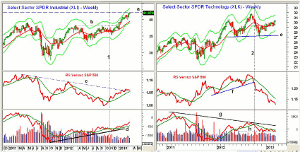
|pagebreak|The Select Sector SPDR Industrials (XLI) has outperformed the SPY so far in 2013. The 2007 high at $41.99 was exceeded last week.
- The weekly Starc+ band is now at $43.30
- The relative performance topped out in 2011, and the long-term downtrend (line c) has just been overcome.
- The RS line moved above its WMA in early November (line 1), and by early December had completed its bottom formation, as discussed in Best Sector Bets for the New Year.
- The weekly OBV dropped briefly below its WMA in November, but turned positive again the following month.
- The daily OBV (not shown) did not confirm the recent highs, so the multiple time frame OBV analysis is now mixed.
- There is initial support now at $40.80 to $41.20, with the late February low at $39.97.
The Select Sector SPDR Technology (XLK) peaked in September at $31.72 and closed last week at $30.20, which is 4.7% below the highs.
- The weekly chart also shows that a doji was formed last week.
- The 38.2% retracement resistance from the 2000 high of $65.44 is at $32.08.
- XLK is only up 4.7% in 2013, which is consistent with the very weak action in the relative performance.
- The RS line broke its uptrend (line f) in the middle of October (line 2), and has continued to make new lows.
- The daily RS analysis (not shown) is also acting weak.
- The OBV violated its WMA in October, and is just barely holding the support (line h).
- There is first support at $29.20 to $29.60.
What it Means: In Friday’s Week Ahead column, I said I was expecting something out of the Eurozone to shock the market, but did not expect it to happen over the weekend.
By looking at the monthly, weekly, and daily relative performance analysis (Spot Market Leaders In Any Time Frame) of the key sector ETFs, it can give you some good insight as to what sectors you should be buying. It can also narrow your stock-selection process.
How to Profit: Cancel the open buy order for Select Sector SPDR Technology (XLK).
Portfolio Update: The Charts in Play portfolio was long the Select Sector SPDR Financial (XLF) at $14.40. We sold one-third at $17.88 and stopped out of the remainder at $17.29.
We are long the Select Sector SPDR Health Care (XLV) at $36.14, and added longs at 39.76 and $40.04. We sold a third at $42.78. Use a stop now at $42.35.
For the Select Sector SPDR Consumer Discretionary (XLY), investors went 50% long at $46.88 and 50% long at $46.26. We sold half at $50.42. Use a stop now at $49.22.


