The yellow metal has experienced five straight months of decline, and MoneyShow’s Tom Aspray takes a technical look to determine whether the bull market is over or just resting.
On Thursday, the Dow Industrials came close to their all-time highs before late selling pushed stocks back into negative territory. Still the Dow Industrials outperformed both the S&P 500 and the small-cap Russell 2000 Index for the month of February.
Gold had another rough day as it lost 1.1% and the Spyder Gold Trust (GLD) was down 5% in February. It has been a wild month for the precious metals and this week’s action pulled traders in both directions.
The Comex April gold contract had rallied from last week’s low of $1554.30 to a high of $1619.70 on Tuesday and this $65 rally gave the bulls some hope. That did not last long as prices have given up $50 of these gains in the past three days. So should the bulls still have hope? Let’s look at the weekly and daily technical outlook.
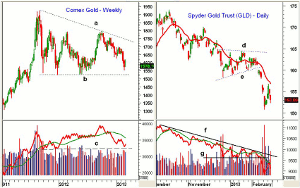
Chart Analysis: The weekly chart of the Comex gold futures shows a broad triangle formation, lines a and b, that has formed since the 2011 highs. The seasonal pattern is for gold to top in early February and then decline into early July.
- The technical outlook currently supports this view as the studies turned decidedly negative early last month.
- The long-term triangle formation, however, is consistent with a continuation pattern or a pause in the major trend.
- This suggests that ultimately gold should stage another powerful rally that will take prices above the 2011 highs.
- The weekly on-balance volume (OBV) dropped below support and its WMA in December and is now closer to long-term support, line c.
- The monthly OBV (not shown) has dropped below its June 2012 lows and is now testing the uptrend that goes back to the 2007 lows.
- The weekly OBV now needs to move above its recent high and its WMA to signal that the worst of selling is over but that would take at least several weeks.
The daily chart of the Spyder Gold Trust (GLD) shows that prices gapped below support on February 11, which completed the flag formation, lines d and e.
- The downside target from the formation was at $154, which has already been exceeded as last week’s low was $150.84.
- The quarterly S2 support is at $149.53 with more important support at $148.27 to $148.53, which corresponds to the late 2011 and the 2012 lows.
- The completion of the flag formation was confirmed by the daily OBV as it dropped below the support at line g as it was already below its WMA.
- The daily OBV rallied back to its WMA on Tuesday but then turned lower.
- As of Thursday, GLD is still trading barely above last week’s close so the weekly OBV (not shown) is trying to turn higher.
- For March, the monthly pivot is at $155.60 with further resistance at $156.80, which was Tuesday’s high.
- The weekly downtrend is now at $162.37.
NEXT PAGE: Gold Miners and Silver Trust Lose Luster
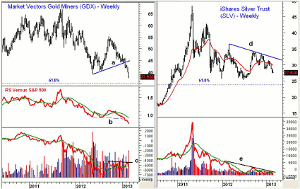
|pagebreak|The gold mining stocks are looking even weaker and the chart of the Market Vectors Gold Miners (GDX) broke its weekly uptrend, line a, at the end of January.
- The May 2012 low of $39.08 was broken this week.
- The major 61.8% Fibonacci, calculated from the 2008 lows at $15.83, is at $35.23.
- This is approximately 7% below current levels.
- The relative performance moved above its WMA for about four months last year but then turned lower in December.
- In the week ending January 25, the RS line dropped below the 2012 lows and the important support at line b.
- The OBV retested resistance at line c, but then dropped below its WMA and volume has been heavy this week.
- There is initial resistance now at $38.50 with much stronger at $39.08-$40.
The weekly chart of the iShares Silver Trust (SLV) peaked last September at $34.05 and has since formed a series of lower highs and lower lows.
- SLV is now down over 19% from the September highs with next support at $25.34, which was the June 2012 low.
- The support at $28.61 was broken in early February.
- The major 61.8% support that is calculated from the 2008 low of $8.45 is at $23.55.
- The weekly OB V is back below its WMA as it just recently tested its downtrend, line e.
- The weekly OBV is close to making new lows but the monthly (not shown) is holding up much better.
- There is initial resistance now at $29.29 with the quarterly pivot and more important resistance at $30.39
What it Means: Each time the market goes into a panic, whether it is Italy’s political dysfunction or the reaction to the FOMC minutes, gold seems to have a sharp one-two day rally.
From a technical standpoint, there are no clear signs of even a short-term bottom for either gold or silver and the weekly outlook would take considerable time before it could turn around.
The gold miners have been recently recommended by some, but they also look very weak, and I would avoid the miners, as well as gold or silver ETFs until we see some positive signs.
No new recommendation.


