While it's still uncertain whether the current correction will recover or deepen in the near term, MoneyShow's Tom Aspray makes a compelling case why investors should not sell their small-cap stocks and run just yet.
The stock market was able to stabilize Tuesday after Monday’s sharp slide, which was positive, and the futures are a bit higher early Wednesday. This is not enough yet to conclude that the market’s correction is already over.
For now, a broad trading range with a downside bias seems the most likely path over the near term. It would take a strong close above Monday’s early highs to suggest that the correction is already over.
In a recent Wall Street Journal article, “The Small-Cap Stock Trap,” it was pointed out that the Russell 2000 is up 19% since the November lows, versus just an 11% gain in the Dow Industrials. The author suggests that the recent strength of small-cap stocks may be trapping investors with higher risk.
As I noted yesterday, the iShares Russell 2000 Index (IWM) has already dropped almost 4% from its highs. However, from a technical standpoint, I do not think that the rally in small-cap stocks is over. A historical look at recent rallies in this area suggests that they should still be on your buy list during the market’s current correction.
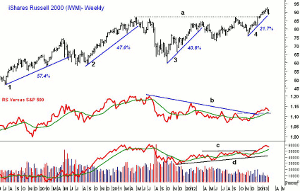
Chart Analysis: On the weekly chart of the iShares Russell 2000 Index (IWM) that goes back to 2009, I have highlighted several periods of strength in small-cap stocks. The performance values are calculated from low to high, and therefore are high, as no one gets in at the low or out at the high.
- From the July 2009 low to the May 2010 high, IWM was up 57.4% (line 1).
- The following correction ended in August 2010, and during the next rally (line 2) IWM gained 47.6%, peaking in May 2011.
- The 40.8% rally from the lows in October 2011 lasted only until March 2012 (line 3).
- From the November 2012 low at $76.13 up to the recent high of $92.68, IWM is up just 21.7% so far.
- The weekly relative performance moved above its WMA on December 1, and before the end of the year broke its long-term downtrend (line b).
- The weekly RS analysis is still positive, and the daily (not shown) did confirm the recent highs.
- The weekly on-balance volume (OBV) moved above its WMA in the middle of December, and broke through strong resistance (line c) in early 2013.
- The OBV has turned lower, but is still well above its rising WMA.
- So far, the support in the $88.80 area is holding, with the 38.2% Fibonacci retracement support at $86.28.
- A daily close above $91.53 would be a sign that the correction is over.
NEXT: How This Affects 2 Related Funds
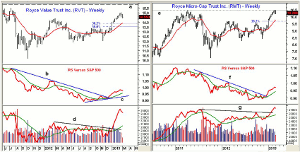
|pagebreak|In the December 12 article Profit Now From January Effect, I recommended two closed-end funds, one of which was the Royce Value Trust (RVT). It is a closed-end fund with a capitalization of $1.1 billion and an expense ratio of 0.68%.
- RVT spiked to a low of $12.03 last November.
- The weekly chart shows that it peaked last week at $15.03, which was well below the 2011 high of $15.90.
- There is initial support at $14.33 to $14.40, and for March the monthly pivot support is at $14.31.
- The 38.2% Fibonacci support and the rising 20-week EMA are at $13.88. The 50% retracement support stands at $13.53.
- The weekly relative performance broke its downtrend (line b) in the middle of December.
- The RS line is well above its WMA and support (line c).
- The weekly OBV did not break through its resistance (line d) until the early part of January.
- So far, the correction looks pretty normal, and a close back above $14.90 would be positive.
The Royce Micro-Cap Fund (RMT) has a capitalization of $1.1 billion and a fairly high expense ratio of 1.58%. From the November lows to the recent highs at $10.44, it has gained 24.6%, which is a bit less than RVT.
- The weekly chart shows that the 2011 high (line e) has been reached.
- So far, there has not been much of a correction. First good support sits at $10 to $10.10.
- The rising 20-week EMA and the 38.2% Fibonacci retracement support are in the $9.69 to $9.87 area.
- The long-term downtrend in relative performance (line f), was overcome the week ending December 22. Also, the WMA of the RS line is rising strongly, which is a positive sign.
- The weekly OBV was able to overcome resistance going back to 2011 (line g) at the end of January.
- The daily studies are clearly positive, and show no signs yet of a top.
What it Means: The seasonal tendency is for iShares Russell 2000 Index (IWM) to bottom in the October to November period. From a February high, IWM typically corrects until March 9, before forming a final high in early May.
In my comparison of the mid- and small-cap stocks earlier this month, I noted that mid caps were starting to act a bit stronger than small caps. This is still the case, but both continue to look better than the large-cap Spyder Trust (SPY).
Once there are clear signs that the correction is over, I will be looking to buy both small- and mid-cap stocks, as well as ETFs.
How to Profit: No new recommendation for now.
Portfolio Update: Investors should still be long the Royce Value Trust (RVT) from $12.98. Half was sold at $14.55 or better for a minimum 12% profit. Keep the stop at $14.18.
Investors should also be long the Royce Micro-Cap Fund (RMT) from $9.08. We sold half at $10.18 or better for a 12.1% gain since mid-December. Keep your stop for now at $9.94.


