Uncertainty is the market’s worst enemy, but politicians around the world don’t seem to understand this fundamental issue, as MoneyShow’s Tom Aspray surveys the current landscape and recommends steps tor protect your portfolio as we head into a choppier period.
Where the Oscars are awarded each year for the best in film, the Razzies are awarded for the worst. Since the financial crisis, it seems as though the world governments have been vying for who is the most incompetent as they try to win next year’s political Razzie.
The US was clearly a leader early in the financial crisis with the House vote in September 2008 against the rescue plan, oblivious to the impact on the global markets. The Dow then dropped 777 points and by the end of the week the House passed a similar measure but the damage was already done. Over the past four years competition has been fierce with many Euro countries vying with the US for the top spot.
The three-way split after Italy’s election, with no clear ruling party, should put them in the lead for next year’s award. This is not reassuring to the many Euro banks with huge holdings of Italian bonds. The global markets started tanking Monday afternoon and the selling has continued overnight. Though I am confident our politicians will be up to the challenge from the Italians given the looming fiscal deadlines investors are unlikely to be throwing any parties.
The market’s surprising strength last Friday suggested that stocks could again challenge the recent highs but that required higher prices on Monday. Instead stocks were hammered Monday and the market internals were extremely weak. The technical readings now favor the deeper correction scenario I outlined last week.
Even though the major average have already reached first good support, I would not expect much of a rebound before there is another wave of selling. It looks as if the major averages are likely to test the September highs and possibly the 38.2% support levels before the correction is over. Let’s examine the current technical outlook.
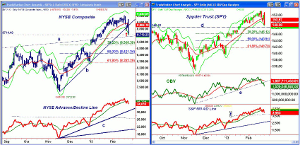
Chart Analysis: The daily chart of the NYSE Composite shows that the daily starc- band was tested last Thursday and after Friday’s bounce, it closed Monday back on the starc- band.
- The trend line support, line a, that connects the April and the September 2012 highs is now at 8687.
- The 38.2% Fibonacci support from the November low is at 8560 with the September highs at 8516.
- The 50% support level is at 8421, which is 3.4% below current levels.
- The NYSE A/D line closed last week back above its WMA but with Monday’s selling it has now dropped below Thursday’s low, which is a short-term negative.
- The A/D line has next important support at the uptrend, line c.
- The fact that the weekly and daily A/D lines did confirm the recent highs is positive for the intermediate term.
- There is initial resistance at 8950 and it would take a close back above 9000 to stabilize the chart.
The Spyder Trust (SPY) had a huge range Monday as it opened strong at $152.63, traded as high as $152.86, before then closing at $149 just above the starc- band at $148.54.
- The September high is at $148.15 and about 2% below Monday’s close is the 38.2% Fibonacci support at $146.12.
- The more important 50% support from the November lows is at $143.91 with the quarterly pivot support at $142.56.
- The daily on-balance volume (OBV) has now broken its uptrend, line e, that goes back to the November lows.
- The OBV did confirm the recent highs and the weekly (not shown) is above its WMA.
- The S&P 500 A/D line has also now dropped below last week’s lows consistent with a short-term downtrend.
- There is next support for the A/D line at line f, with stronger at the uptrend (line g).
- There is resistance now at $150 to $151.50.
NEXT PAGE: More Turmoil Ahead
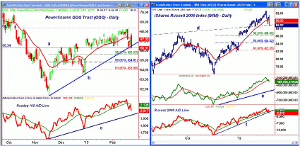
|pagebreak|The PowerShares QQQ Trust (QQQ) also had a wide range Monday as it closed on the daily uptrend, line b, and just above the quarterly pivot at $66.10.
- There is further chart support at $66.34 (line a) with the 38.2% Fibonacci retracement support at $65.63.
- The more important 50% support is at $64.81.
- A close below the 61.8% support and the late December low at $63.58 will signal a drop to the $60 level.
- The Nasdaq 100 A/D line rebounded back to its WMA last week before turning lower Monday.
- The A/D line is now in a short-term downtrend with next support at the uptrend, line c.
- There is more important support at the late December lows.
- The declining 20-day WMA is at $67.22 with further resistance at $67.80-$68.
The iShares Russell 2000 Index (IWM) peaked last week at $92.68 and closed Monday at $89.02 as it is down 3.9% from its high.
- IWM closed on the support, line d, that connects the 2012 highs.
- The September high and the monthly pivot support are in the $87 area.
- The 38.2% retracement support is at $86.30 with the 50% support at $84.32, which is the lower boundary of the early 2013 gap.
- The daily OBV did confirm the highs last week but has now dropped below its WMA.
- The weekly and monthly OBV (not shown) are both above their WMA so the multiple time frame analysis is positive.
- The daily Russell 2000 A/D line has just broken its uptrend, line f, and its WMA has flattened out.
- There is initial resistance at $90.20 and the flat 20-day EMA with more important at $91.53.
What it Means: The Monday afternoon selling seemed to reach panic levels and the sharp rally 34% rally in the VIX or the fear index certainly supports this view. The confirmation of the recent highs by the NYSE Advance/Decline indicates this will be a correction within the longer-term uptrend.
Those stocks that show the best relative performance should hold up best on a further correction but it is important to have your stops in place and not react to any signs of panic in the market.
Since the latter part of January (Are You Ready for a February Surprise?), I have been taking some profits and raising stops, which has reduced the equity exposure in the Charts in Play portfolio by about 20%. Further stops are likely to be hit in the coming weeks and the next real bounce should be an opportunity to do some light hedging.
How to Profit: No new recommendation
Portfolio Update: Should still be long the iShares Russell 2000 Index (IWM) from $82.55 as half the position was sold on 2/15 at $91.74. Use a stop for now at $87.92 but keep an eye on my Twitter feed.
Per yesterday’s recommendation, should be 50% long the SPDR Diamond Trust (DIA) at $139.56 and 50% long at $138.74. The stop is at $134.91. I would close out at $138.44 or better and take the small loss.


